v0.9.17: Visual EXPLAIN Arrives

v0.9.17 is centered around one feature: Visual EXPLAIN.
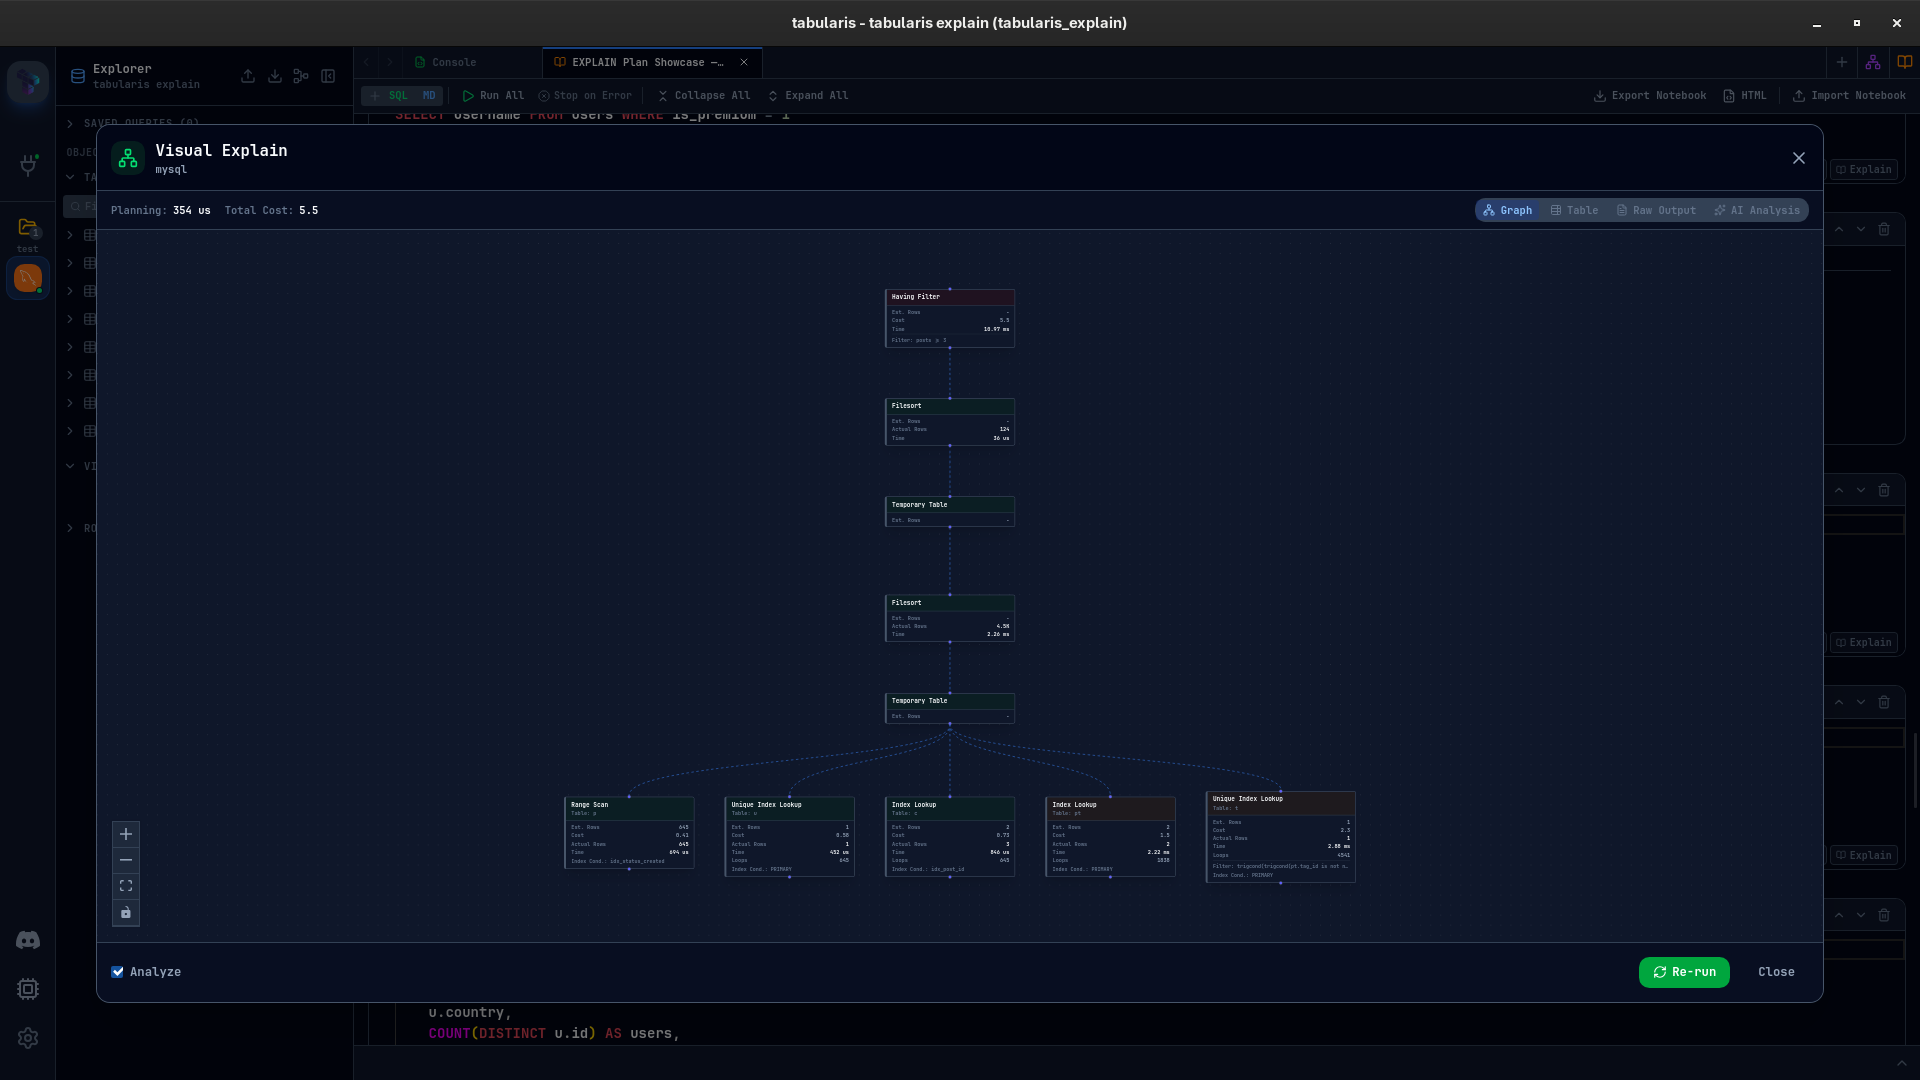
Instead of treating query plans as raw text you have to decode manually, Tabularis now opens them in a dedicated full-screen workflow with a graph view, a table view, raw output, and optional AI analysis. If you spend time tuning joins, tracking down slow scans, or checking whether an index is actually used, this is the release that makes that workflow much more practical.
Visual EXPLAIN, Now Built In
You can now run Visual EXPLAIN directly from the SQL Editor and from Notebook SQL cells.
Tabularis selects the right explain format for the current driver, parses the result, and shows the plan in four synchronized views:
- Graph for the execution tree and expensive nodes
- Table for exact metrics and per-node details
- Raw for the original database output
- AI Analysis for a second-pass explanation of likely bottlenecks
The goal is simple: less time decoding plan output, more time understanding what the optimizer is doing.
Why This Matters
EXPLAIN is one of the most useful tools in SQL, but the output is rarely pleasant to work with. PostgreSQL gives you rich JSON, MySQL changes behavior depending on the server version, MariaDB exposes its own fields, and SQLite gives you a much flatter structural plan.
In v0.9.17, Tabularis smooths over those differences and turns them into one consistent inspection workflow.
That means you can:
- Spot the highest-cost node without scanning raw output line by line
- Compare estimated rows against actual rows when ANALYZE data is available
- Inspect filters, index conditions, loops, and buffer data in one place
- Re-run the plan after an index or query rewrite and check what changed
For PostgreSQL in particular, this is a major upgrade over bouncing between the editor and external tooling just to inspect a single plan.
The Main Pieces of Visual EXPLAIN
The new workflow is more than a single graph.
Graph and Node Details
The default view renders the execution plan as a node graph with cost-based coloring, so the expensive parts of the query stand out immediately. Selecting a node opens a detail panel with the metrics and conditions attached to that step.
This makes it much easier to answer questions like:
- Where is the scan happening?
- Which join is dominating cost?
- Is the estimate badly wrong at a specific node?
- Is the plan using the index you expected?
Overview Bar
An overview section highlights the most relevant signals from the plan, including the highest-cost node, the slowest step, large estimate gaps, sequential scans, and temporary operations. Instead of reading the whole plan top to bottom first, you can jump directly to the suspicious areas.
AI Analysis
Visual EXPLAIN also adds a dedicated AI analysis flow. Tabularis can send the query and raw plan output to the configured provider and return a structured explanation of what the plan is doing, where the likely bottlenecks are, and what might be worth testing next.
This release also introduces a cleaner AI dropdown button in the notebook and editor UI, which fits well with the new explain-analysis workflow.
Cross-Database Support
Visual EXPLAIN is not PostgreSQL-only.
v0.9.17 adds driver-aware handling for:
- PostgreSQL with JSON plans, ANALYZE support, and buffer statistics
- MySQL with automatic version detection and fallback between
EXPLAIN ANALYZE,EXPLAIN FORMAT=JSON, and tabularEXPLAIN - MariaDB with JSON parsing improvements for filesort, wrappers, and subquery cache details
- SQLite with reconstructed plan trees from
EXPLAIN QUERY PLAN
That cross-driver work is a large part of what makes this release important. The UI is visible, but most of the value comes from normalizing very different execution-plan formats into one model that Tabularis can actually visualize.
Finding Tabularis useful? Star it on GitHub — it takes a second and helps more developers discover the project. Star on GitHub
Safer Explain Workflows
There are also a few practical guardrails in this release.
Tabularis now checks whether a query is actually explainable before sending it to the database, strips leading comments before validation, and handles EXPLAIN ANALYZE more carefully for data-modifying statements.
In practice, that means:
- DDL statements are blocked before they turn into confusing errors
- Annotated queries still work as expected
INSERT,UPDATE, andDELETEare treated more carefully when ANALYZE would execute them
These details matter because they keep Visual EXPLAIN useful in real-world workflows, not just in ideal demos.
Smaller Improvements
Visual EXPLAIN is the headline, but not the only change in v0.9.17.
- Multi-database connection editing now auto-loads databases
That keeps the release focused, with a small usability improvement around connection setup alongside the new query-plan workflow.
Read the Plan, Stay in Context
The interesting part of this release is not just that Tabularis can run EXPLAIN. Plenty of tools can do that. The useful part is that the result stays inside the same environment where you are writing and testing the query.
Run the query. Open the plan. Inspect the graph. Check the exact node metrics. Re-run after a change.
If you want the full walkthrough, there is now a dedicated Visual EXPLAIN documentation page and the earlier feature preview post with more screenshots and background.


v0.9.17 is available now. Update via the in-app updater, or download from the releases page.