4 posts tagged with #performance
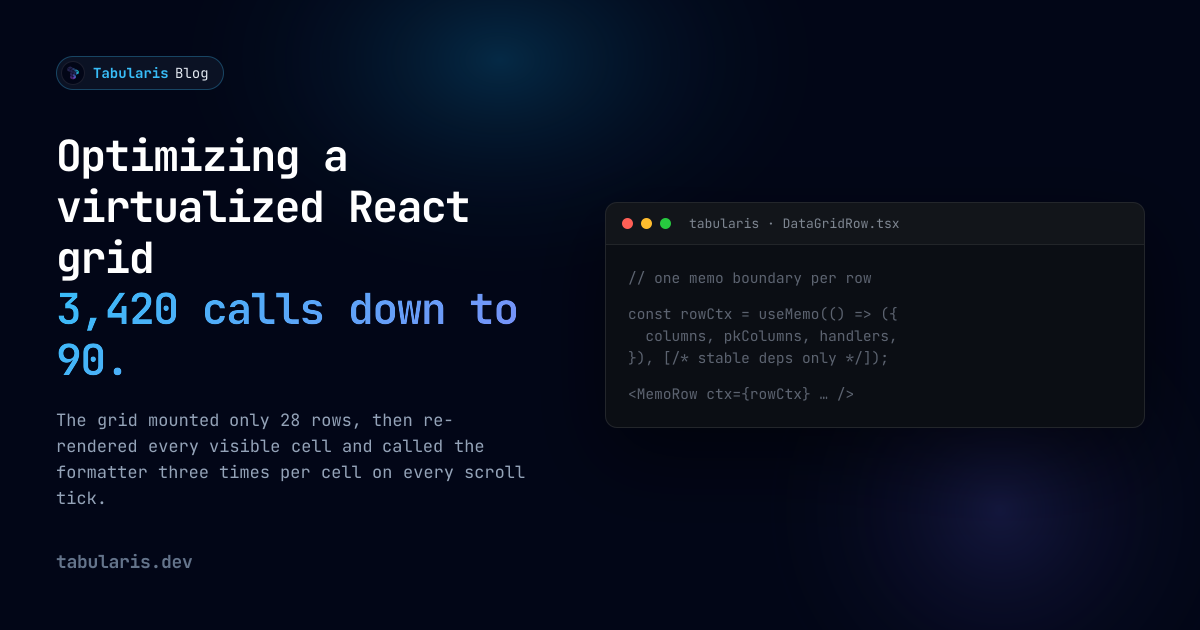
The Tabularis data grid was already virtualized, but wide tables still took 29 ms of React render work per scroll tick. The bottleneck was the visible rows, not the total row count.
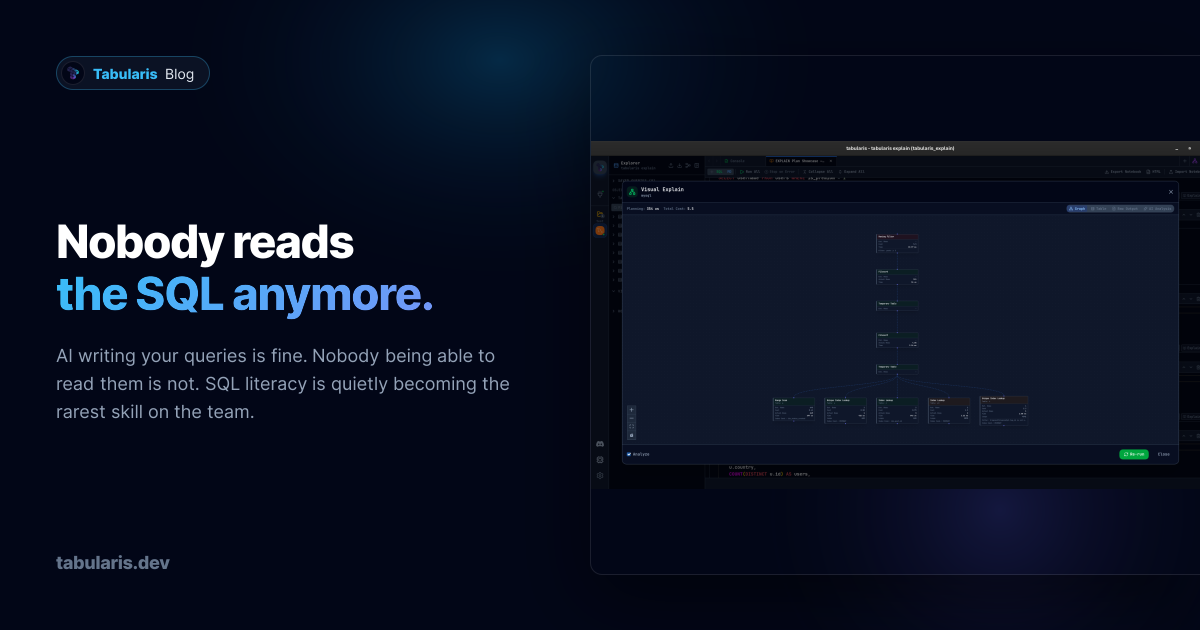
AI writing our queries is fine, and often better than fine. But reading skill was funded by writing, and now that the writing is gone, the reading is decaying while the volume of SQL entering our codebases goes up. Some thoughts on why SQL is the worst possible language for this to happen to.
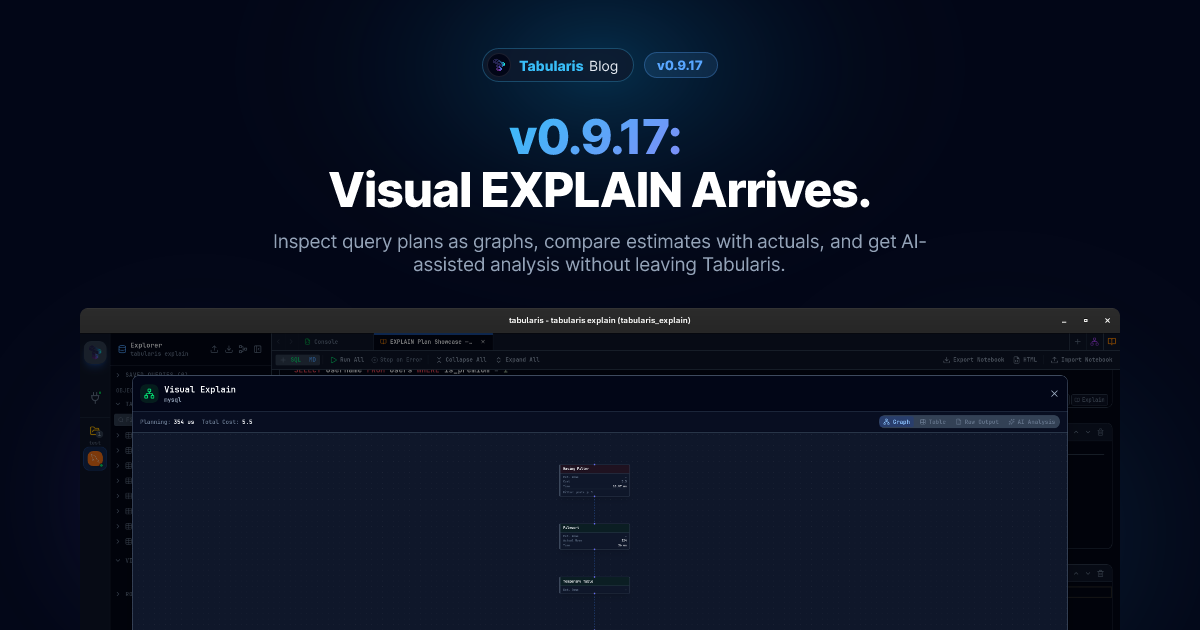
v0.9.17 brings Visual EXPLAIN to Tabularis: interactive execution plan graphs, table and raw views, AI-assisted analysis, and cross-database support for PostgreSQL, MySQL, MariaDB, and SQLite.
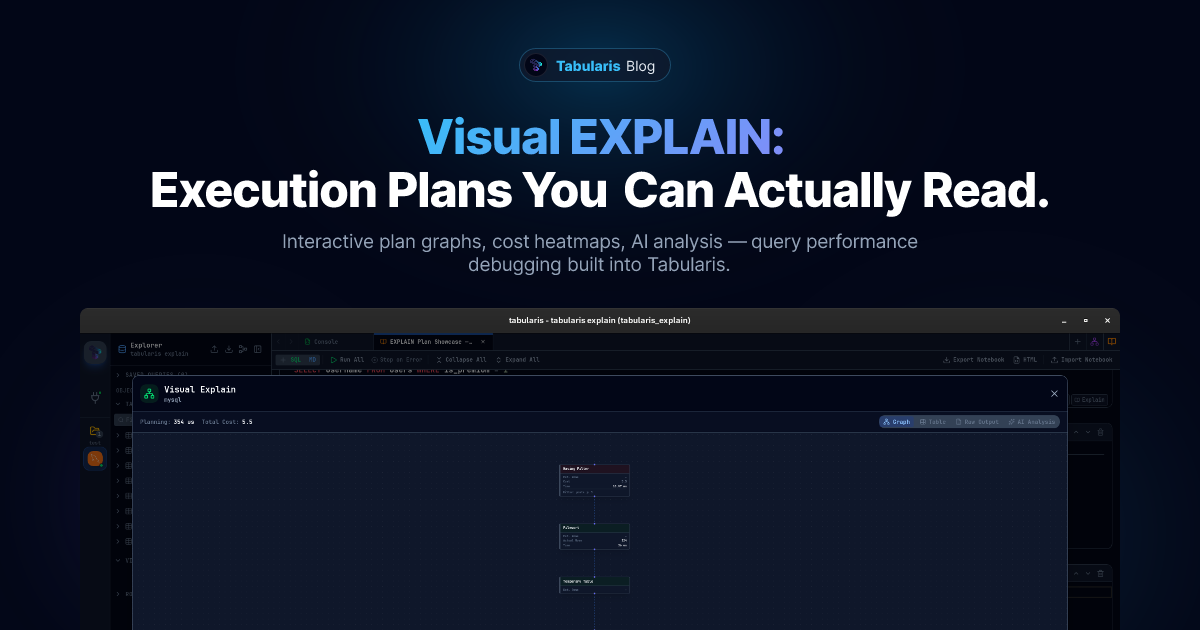
A preview of Visual EXPLAIN in Tabularis — interactive execution plan graphs, tabular breakdowns, raw JSON output, and AI-powered analysis. Works with PostgreSQL, MySQL, MariaDB, and SQLite. Still in development, with PostgreSQL as the primary focus.
Get release notes, tips, and project updates. No spam, unsubscribe anytime.
Quick searches