

Our React data grid was already virtualized, but it still stuttered on wide tables. In a headless benchmark, a 30-column table took 29.2 ms of React render work on each scroll tick. After the fix, the same test took 4.4 ms.
The problem was not the 1,000 rows in the result set. It was the 38 rows in the virtual window. Every scroll update rendered all of them again, including cells that had not moved.
I fixed this in June for v0.13.2, initially based on the very scientific observation that it felt smoother. For this post I went back, ran the old and new code through the same benchmark, and published the harness and raw results.
The short version: at 30 columns, the old grid called formatCellValue 3,420 times per tick. After PR #287, the same tick calls it 90 times.
Virtualized, and still janky
The Tabularis results grid has used TanStack Virtual since its early versions. With a 600px-tall viewport, 35px rows, and overscan, the DOM holds roughly 28 rows at rest, whether the result set has 500 rows or 100,000. Total row count was not the source of the scrolling problem, and this fix did not change the windowing strategy.
The problem showed up on wide tables. A few hundred rows and 30 to 40 columns is a normal shape for a denormalized reporting table, and scrolling visibly dropped frames. That was confusing at first because "virtualize your list" is the standard answer to slow grids, and we had already done it.
Virtualization limits how much UI exists at once. It does not make the visible subtree cheap. We had bounded the number of rows, but the work per visible row was still too high.
Where the work was going
The old DataGrid.tsx rendered rows inline, right inside the component body:
{rowVirtualizer.getVirtualItems().map((virtualRow) => {
  // ~560 lines of row and cell JSX, inline in DataGrid
})}
Scrolling updates the virtualizer, the virtualizer re-renders DataGrid, and because the row JSX is inline, re-rendering DataGrid re-executes the render of every visible row and cell. There was no memo boundary anywhere between "the scroll offset changed" and "re-run the JSX for cell 37 of row 214, which did not change."
There was more work inside each cell. The old code reached formatCellValue, which turns a raw database value into display text, through three call sites per normal cell render:
- the TanStack Table
cell:renderer, - the
titleattribute used for the hover preview, - the main display path, which eventually called the column renderer again.
I originally described this as three direct calls in the row loop. That was imprecise. Two calls were explicit in the row loop; the third came through flexRender and the column renderer. The benchmark sees all three because it wraps formatCellValue itself. The duplication accumulated across separate features, and each call site looked reasonable in isolation.
There was another cost too. Every row carried data-index and ref={rowVirtualizer.measureElement}, asking the virtualizer to measure rows dynamically even though normal data rows have a fixed 35px height. MiniResultGrid, the smaller grid in the visual query builder, already used fixed sizes.
The fix is one memo boundary
The main change in PR #287 was conceptually small: extract the row into DataGridRow.tsx and make React.memo actually hold. You can read the GitHub diff or the raw .diff.
export const MemoRow = React.memo(function MemoRow(rowCtx: MemoRowProps) {
  // renders one <tr>
});
The second half of that sentence is the difficult part. React.memo with the default shallow comparison is only as good as the identity of the props you pass. A row needs column metadata, pending edits, handlers, foreign keys, and a translation function. If any one of those props gets a new identity on every parent render, the memo silently does nothing and you are back to rendering everything.
So the props are split by volatility.
Everything that is stable for the whole grid goes into one object, memoized once in DataGrid:
/**
 * Stable, per-grid dependencies shared by every row. Bundled into a single
 * object that is memoized in DataGrid so React.memo's default shallow compare
 * on MemoRow only sees a new `ctx` reference when one of these actually changes.
 */
const rowCtx: RowCtx = useMemo(
  () => ({ columns, pkColumns, pendingChanges, columnTypeMap, /* … */ }),
  [columns, pkColumns, pendingChanges, columnTypeMap, /* … */],
);
Everything that varies per row is computed in the parent's .map and passed as primitives:
<MemoRow
  ctx={rowCtx}
  rowIndex={rowIndex}
  isSelected={isSelected}
  isPendingDelete={isPendingDelete}
  editingColIndex={isRowEditing ? editingCell!.colIndex : null}
  focusedColIndex={isRowFocused ? focusedCell!.colIndex : null}
/>
The primitive part matters more than it looks. The obvious thing to do is pass editingCell, the {rowIndex, colIndex, value} object from state, straight down. But that object gets a new identity on every keystroke, and shallow compare would then invalidate every row, not just the one being edited. Passing editingColIndex as a number means row 214 receives null before the keystroke and null after it, so the memo holds. The row selection set and pending-deletion map stay out of rowCtx for the same reason: they change identity when one row changes, so each row instead receives its own isSelected and isPendingDelete booleans. The actual MemoRow call site shows the full prop split.
Handlers needed one more trick. handleEditCommit and handleKeyDown read the current editing state. Putting editingCell in their useCallback dependencies would give them a new identity per keystroke and invalidate rowCtx, which contains them. I used a ref:
// Mirror of editingCell so the commit/keydown callbacks can read the latest
// value without listing editingCell in their deps; this keeps their identity
// stable so the memoized rows don't re-render on every keystroke/scroll.
const editingCellRef = useRef(editingCell);
useEffect(() => {
  editingCellRef.current = editingCell;
}, [editingCell]);
The callbacks read editingCellRef.current and keep a stable identity for the life of the grid.
While the row render was being extracted, the three formatter paths collapsed into one call per cell. Dynamic measurement also went away: the data <tr> gets style={{ height: 35 }}, measureElement and data-index are gone, and the virtualizer keeps its estimateSize: () => 35.
Proving it, not vibing it
At the time, I verified this the way most frontend performance work gets verified: opened a wide table, scrolled, said "yeah, that's better." For this post I wanted actual numbers, so I built the benchmark I should have built in June.
The setup uses a git worktree pinned to 7def318b, the commit immediately before the memoization change, and another worktree on main at v0.15.0. Both run the same Vitest file. The harness renders the real DataGrid, TanStack virtualizer, and cell components in jsdom, wraps the grid in a React <Profiler>, then drives it with synthetic scroll events and keystrokes.
main has picked up smaller grid changes since the original fix, including precomputed result-color classes. The after numbers therefore describe v0.15.0, not commit 61794dc2 in isolation. For the original code change, use the before/after diff.
The harness records two metrics:
- React render duration per scroll tick, from the Profiler's
actualDuration. I called this "commit time" in the first draft, but that was wrong. React documents it as the time spent rendering the committed update, not the duration of the commit phase. - Calls to
formatCellValueper tick, counted by wrapping the real function. In the new code this equals the number of rendered cells because each cell calls it once. In the old code each normally displayed cell called it three times, so this metric is an exact call count, not a direct cell-render count.
Both sides run React 19.2.4 on the same machine and Node version. The figures are medians over 7 runs of 30 scroll ticks each. Every tick scrolls 105px, or three rows.
There are important limits. jsdom has no real layout, paint, or GPU. The Profiler figures measure React render work, not browser frame time, style recalculation, or compositing. The dynamic-measurement change is therefore not represented faithfully by this harness. The test also uses React's development build, so the absolute timings should not be read as production timings. Both variants run in the same environment, which makes the comparison useful, but this is still a bundled before/after benchmark. It does not isolate how many milliseconds came from row memoization, formatter deduplication, fixed row height, or the smaller changes added after PR #287.
Getting jsdom to virtualize at all took some digging. TanStack Virtual measures the scroll container via offsetWidth and offsetHeight, which jsdom reports as zero, so the virtualizer rendered no rows. The harness stubs those getters with a 1200 by 600px viewport and 35px rows. That produces about 38 rendered rows including overscan. It reproduces the windowing behavior needed for this test, but it is not a substitute for a browser benchmark.
The numbers
Scrolling, 1,000-row table:
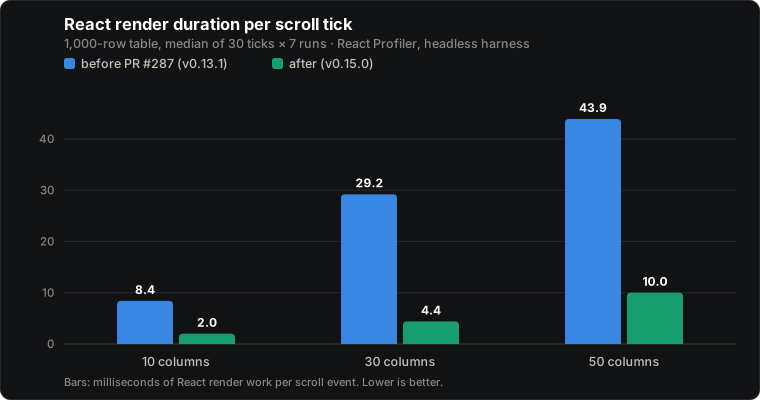
At 30 columns, React's actualDuration fell from 29.2 ms to 4.4 ms per scroll update. At 50 columns it fell from 43.9 ms to 10.0 ms. These are development-build figures from the headless harness, so the comparison matters more than the absolute values.
The call counts explain the ratio:
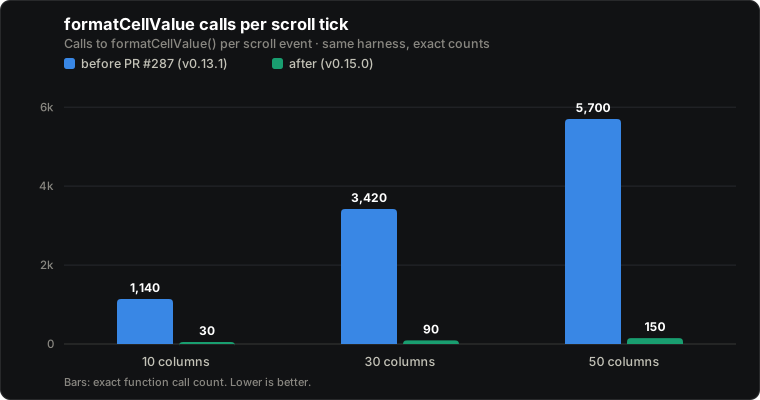
The call counts decompose exactly. The old result is 38 rendered rows × 30 columns × 3 formatter calls per cell = 3,420. A 105px tick brings 3 rows into the new render window, so the new result is 3 × 30 × 1 = 90. The other 35 rows do not render again. The 38-fold reduction combines two changes: unchanged rows now bail out, and each rendered cell formats its value once instead of three times.
Typing is the case I find more satisfying, because it's where the editingCellRef trick earns its keep:
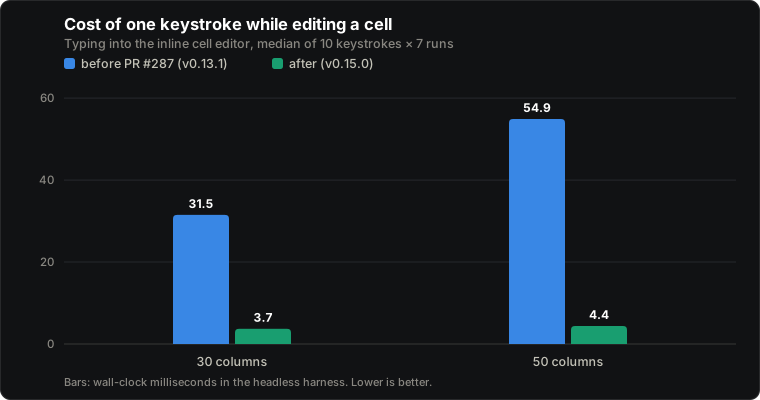
Before the fix, every keystroke in the inline editor re-rendered all 28 rows in the window. That produced 2,517 formatter calls to display one character: 28 × 30 × 3, minus the three calls for the cell showing an <input>. In the headless test, a 50-column table took 54.9 ms per keystroke. After the fix, only the edited row re-renders, producing 30 formatter calls and a 3.7 ms update at 30 columns.
One mount-time number is also useful. The old grid made 2,520 formatter calls on mount, three per rendered cell. The new grid made 840. Both call counts were identical with 1,000 and 100,000 result rows, confirming that virtualization bounded the rendered window. Total mount time still grew with the result set because TanStack Table had to build its row model, which is a separate cost this change did not address.
A bad mock invalidated every row
The first benchmark run exposed a mistake in my setup: the memoized grid re-rendered all 38 rows on every tick, exactly like the old one. It made 1,140 formatter calls where I expected 90. There was no error and the test still passed.
The cause was one line in the shared Vitest setup. It mocked react-i18next like this:
useTranslation: () => ({
  t: (key: string) => key,   // a NEW function on every call
}),
A fresh t function was created on every render. t is a member of rowCtx because the row uses it for NULL labels. A new t produced a new rowCtx, the shallow comparison failed, and every row rendered again. The application did not show this behavior because its t reference remained stable in this scenario. I changed the harness to return a singleton mock, then the expected gap appeared.
A context-object memo is only as strong as its least stable member. One prop with per-render identity, such as a translation function, inline callback, or freshly filtered array, can turn the memo into a no-op. Nothing breaks and React does not warn you. I wrote the component and still got the benchmark wrong on the first run, so reading the code was not enough. The corrected singleton mock is in the published harness.
What's deliberately not done
Column virtualization. The grid renders every column of every visible row, so a 200-column table still does 200 columns' worth of cell work per new row. At 50 columns, the headless result was 10.0 ms per tick. The demo stack includes perf_demo.wide_table, with 50 columns and 50,000 rows, seeded for MySQL and Postgres by demo/generate-perf-sql.py, so the case is easy to test in a real browser.
Horizontal virtualization has to coexist with a sticky header, a sticky row-number column, and an expansion row that uses colSpan. Virtualizing columns would break that expansion layout unless the editor became an overlay. I have left it out until a real workload justifies that complexity. If you have one, open an issue.
If you have a slow virtualized grid
The checklist I wish I'd had before shipping the janky version, in the order I'd apply it:
- Count renders before timing them. Wrap something every cell calls and count invocations per scroll event. If the count tracks visible cells instead of newly visible cells, inspect component invalidation before changing the virtualizer.
- Put the memo boundary at the row, not the cell (too many boundaries) and not the body (too few).
- Split props by volatility. Grid-stable values go in one memoized context object; per-row volatile values go in as primitives, computed in the parent. Never pass the raw
editingCell/focusedCellstate objects into memoized children. - Stabilize handlers with refs, not by widening dependency arrays.
- If your rows are a fixed height, tell the virtualizer and delete
measureElement. Measurement is for content that actually varies. - Re-verify after refactors. The memo is invisible when it stops working. A render-count assertion is cheap insurance.
Source and reproduction
- PR #287 and its Files changed view
- Before/after GitHub diff and raw diff
- Old
DataGrid.tsxand extractedDataGridRow.tsx - Benchmark README, test harness, raw results, and chart generator