
SQL Notebooks
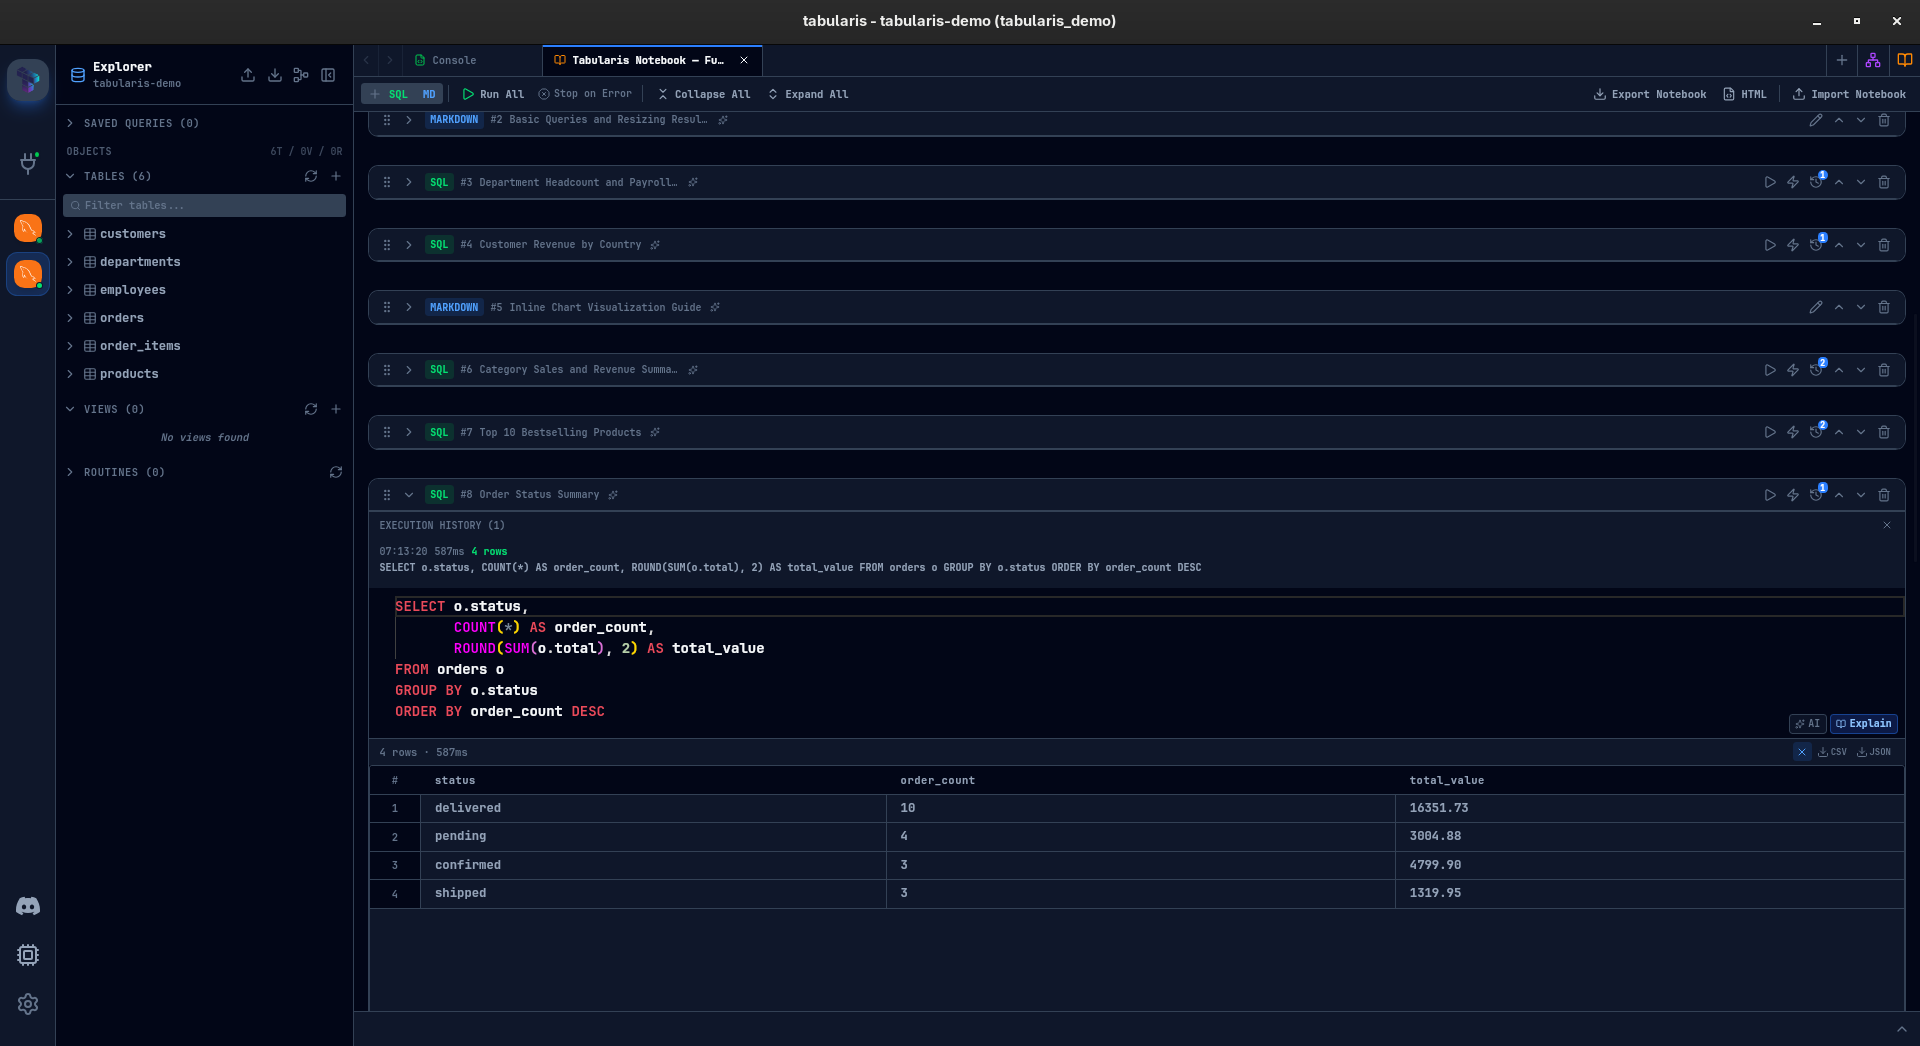
SQL Notebooks bring a notebook-style workflow to Tabularis. Instead of juggling multiple console tabs, you can organize SQL queries and documentation into a single, structured document — run cells individually or sequentially, visualize results with charts, and share the whole thing as an HTML export.
Video unavailable
Creating a Notebook
Click the + dropdown in the tab bar and select New Notebook. A new tab opens with an empty notebook. From here you can add two types of cells:
- SQL — a full Monaco editor with execution, inline results, charts, and per-cell schema selection.
- Markdown — a text block with editing and preview toggle, useful for documenting queries, adding notes, or logically separating sections.
Use the + Add Cell buttons between cells (or at the bottom of the notebook) to insert new SQL or Markdown blocks wherever you need them.
SQL Cells
Each SQL cell is a self-contained query environment:
- Monaco editor with full syntax highlighting and context-aware autocomplete (same engine as the SQL Editor).
- Execute with the play button or
Cmd/Ctrl + Enterto run the cell. - Inline results appear directly below the cell — no need to switch views.
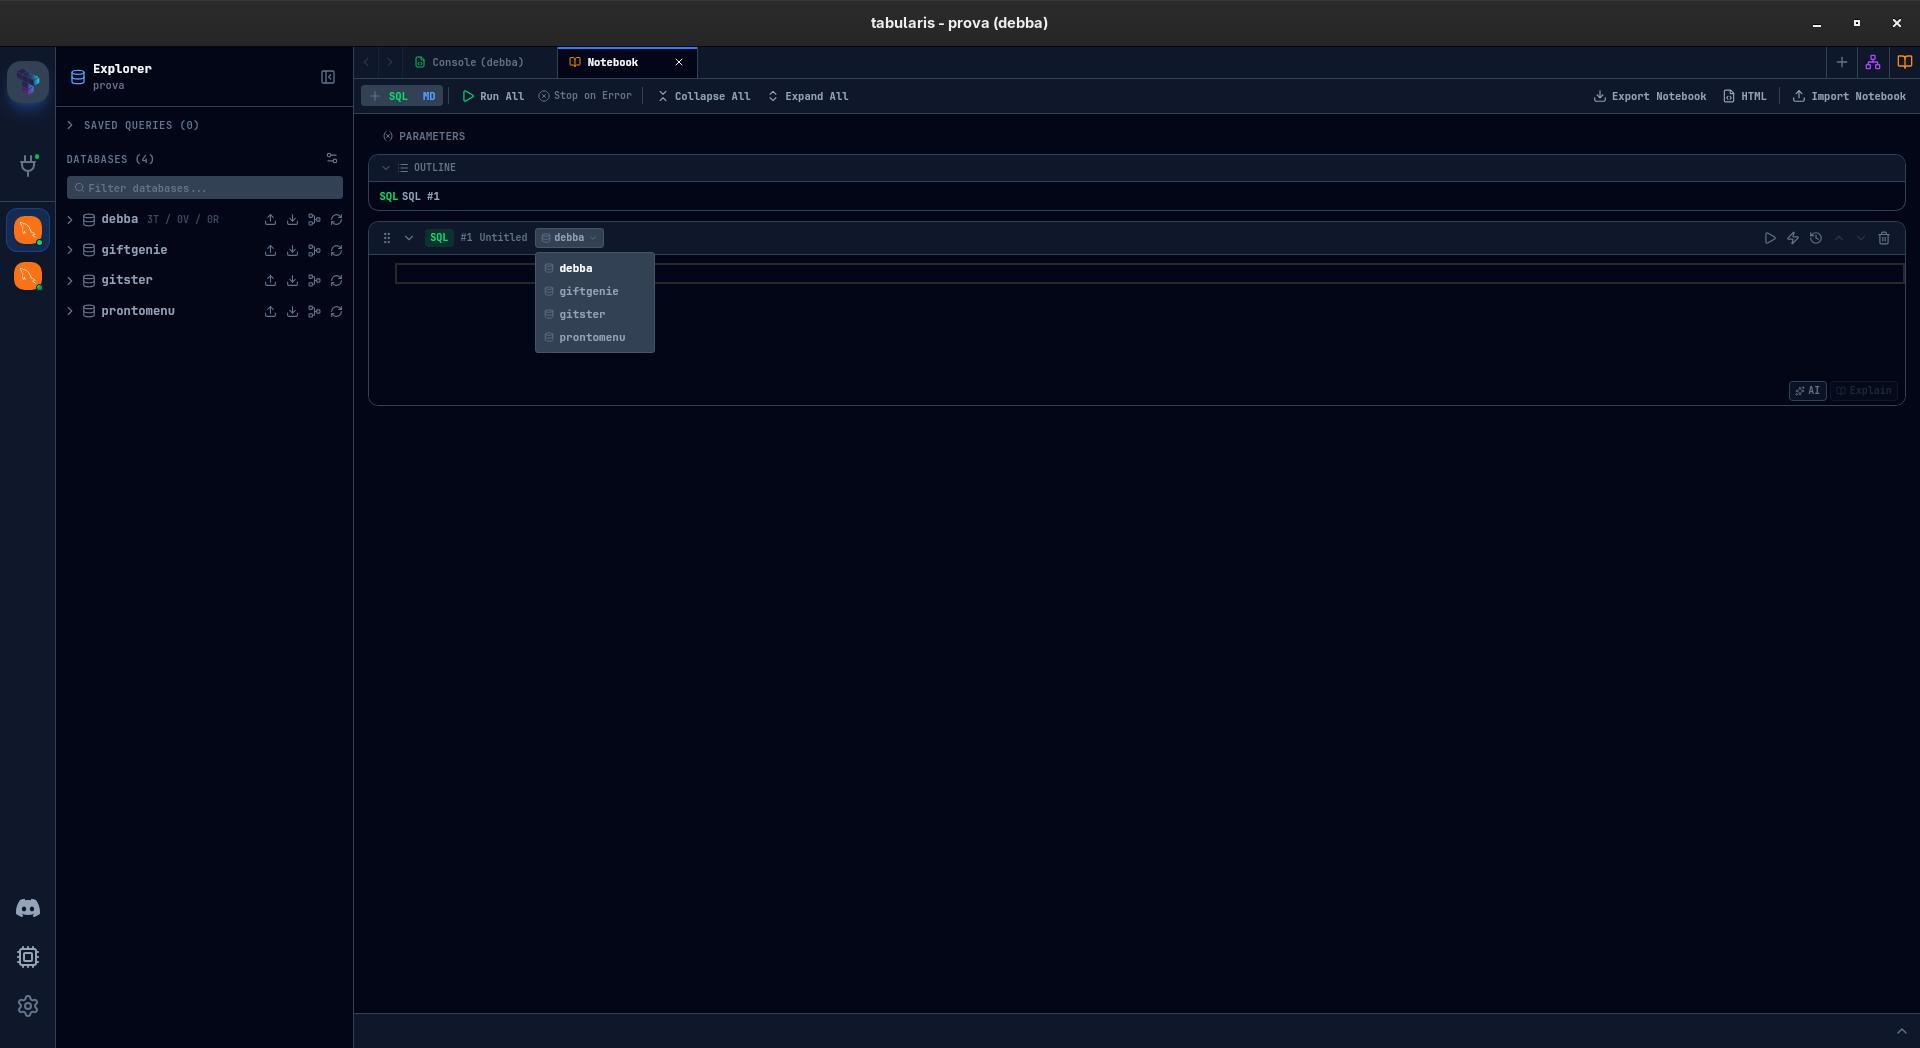
- Per-cell schema selector — useful with multi-database connections, each cell can target a different database or schema.
- Resizable results panel — drag the handle to adjust how much space results occupy.
Inline Query Plans
Since v0.24.0, SQL cells on connections with EXPLAIN support have a Show query plan button in the cell header. It opens a resizable Query Plan section with the same views as Visual EXPLAIN, a Re-run button and a popout to the full viewer. The popout reuses the fetched plan without another database request. Plan visibility is saved per cell and included in notebook exports.
- Opening the section requests plain EXPLAIN once. Analyze is off initially; selecting it does not execute a query until you click Re-run. ANALYZE really executes SQL, including writes for data-modifying statements.
- The plan uses resolved
@paramvalues and{{cell_N}}references. Missing cell results are listed as unresolved references, and no request is sent until they are available. - Changing the query, connection or schema invalidates the displayed plan and resets the source-specific Analyze choice. Click Re-run for a fresh plan; running the cell does not automatically refresh EXPLAIN.
- The section can be resized independently. Moving a cell preserves its editor and plan state.
Video unavailable
Charts
After running a SQL cell, click the Chart toggle in the result toolbar to visualize the data.
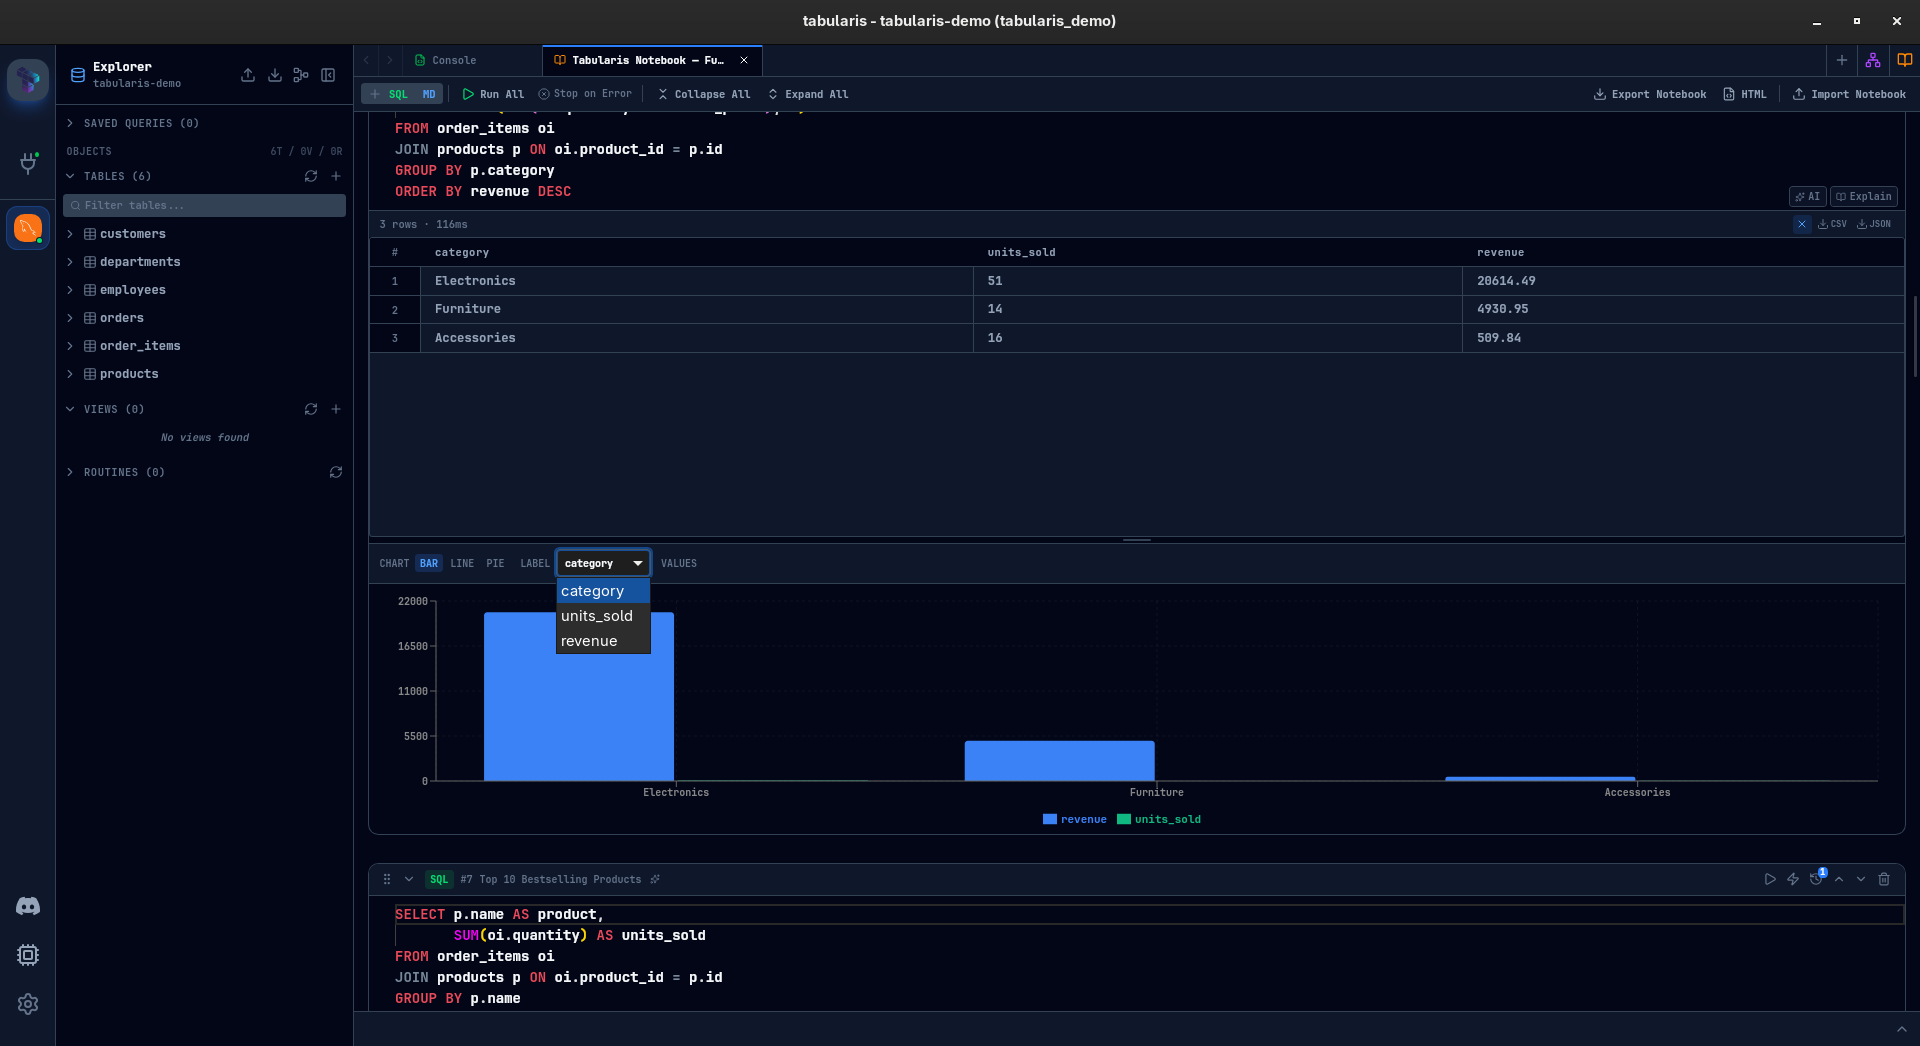
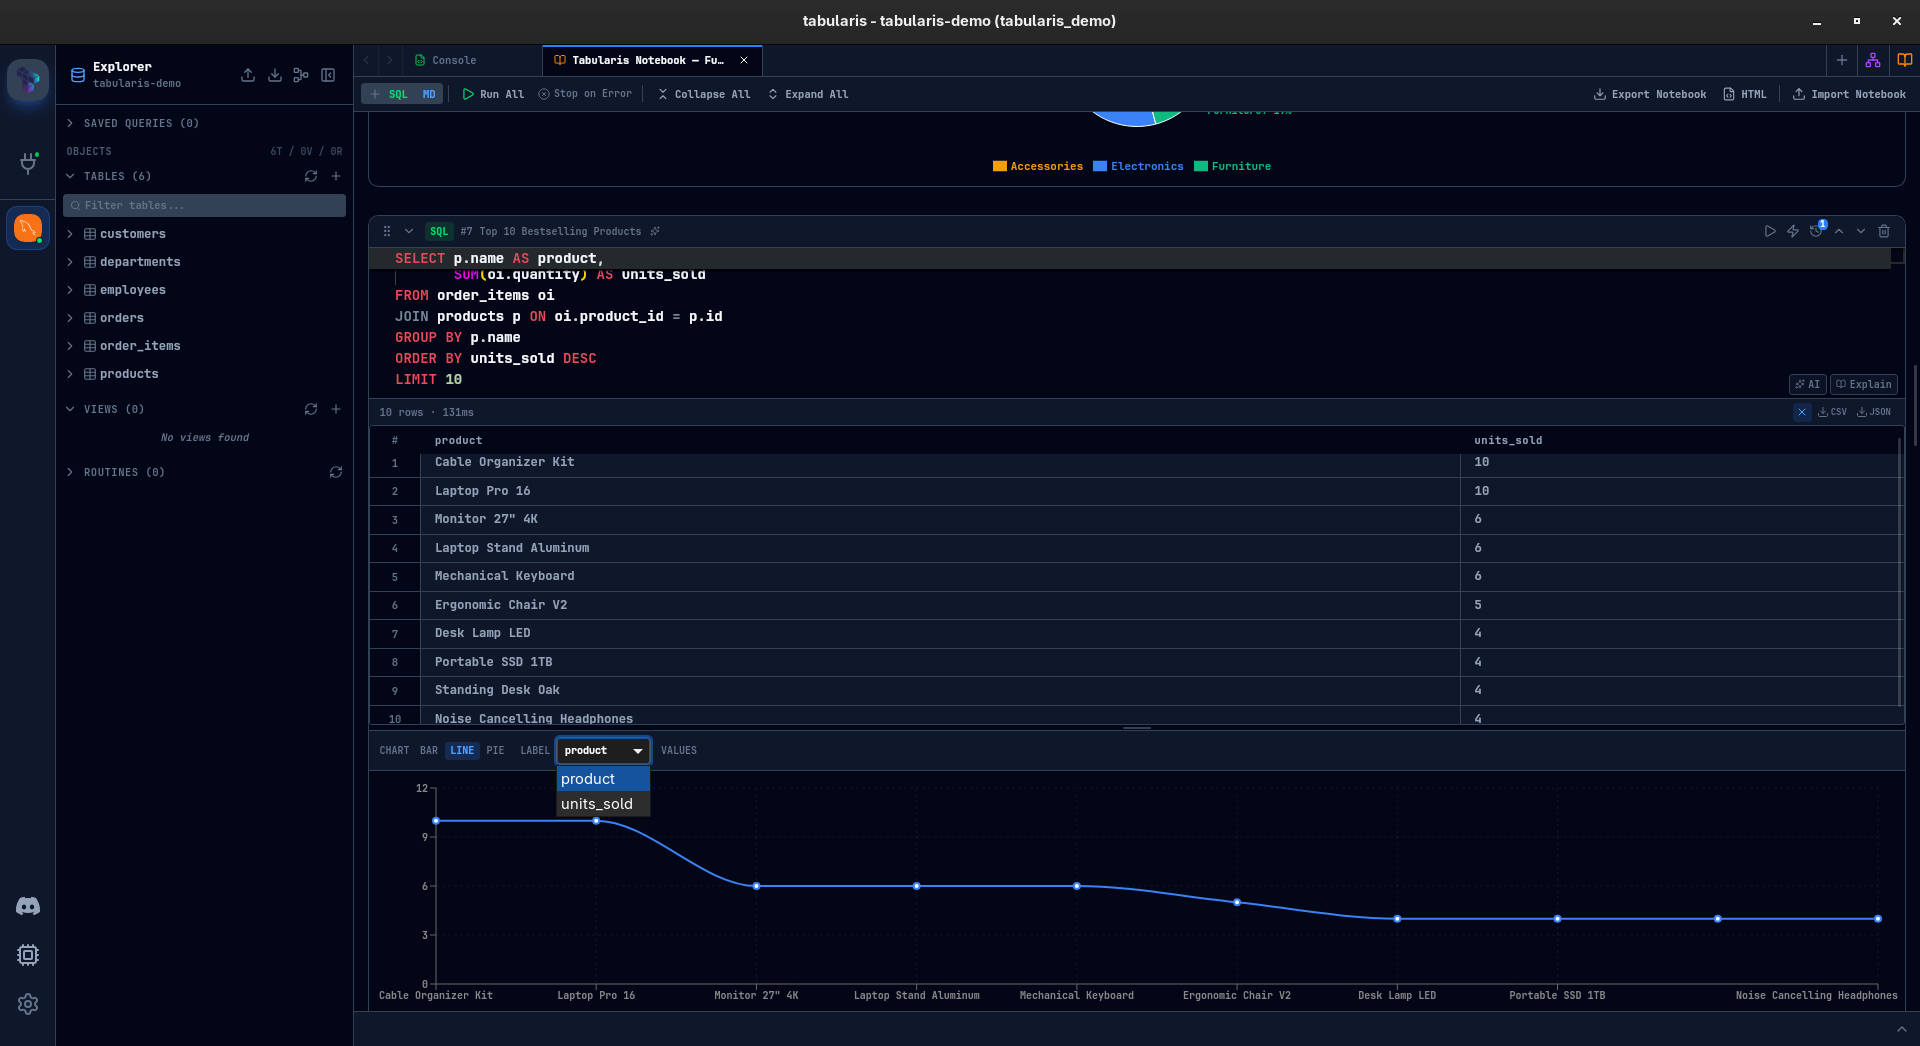
Three chart types are supported:
| Type | Best for |
|---|---|
| Bar | Comparing discrete categories |
| Line | Trends over time or ordered sequences |
| Pie | Proportional breakdowns |
Configure the chart by selecting a label column (X axis / categories) and one or more value columns (Y axis / slices). Charts are rendered with Recharts and update live as you change the configuration.
Execution History
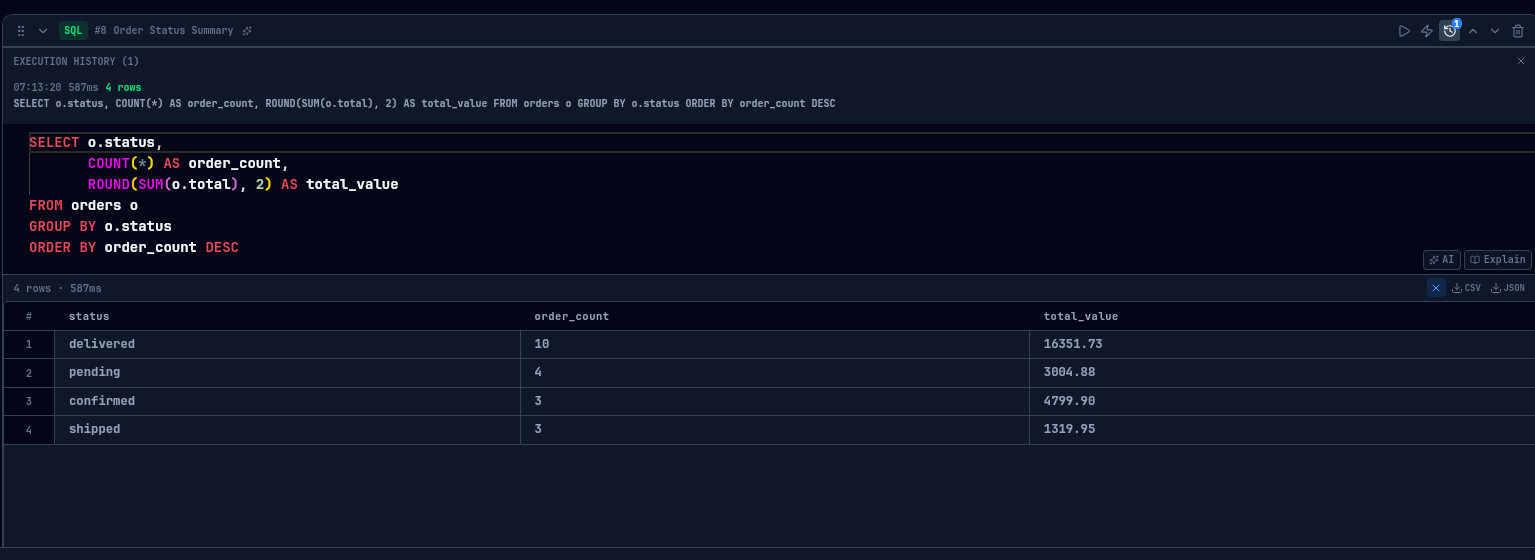
Each SQL cell keeps a local history of past executions. Click the History icon in the cell header to browse previous queries and results. This is useful for comparing how results change as you iterate on a query.
Markdown Cells
Markdown cells support standard Markdown syntax. Toggle between Edit and Preview mode with the eye icon. In preview mode, the rendered Markdown is displayed inline. These cells are ideal for:
- Documenting the purpose of a query or section.
- Adding headings to organize the notebook visually.
- Writing notes about findings or next steps.
Cross-Cell Variables
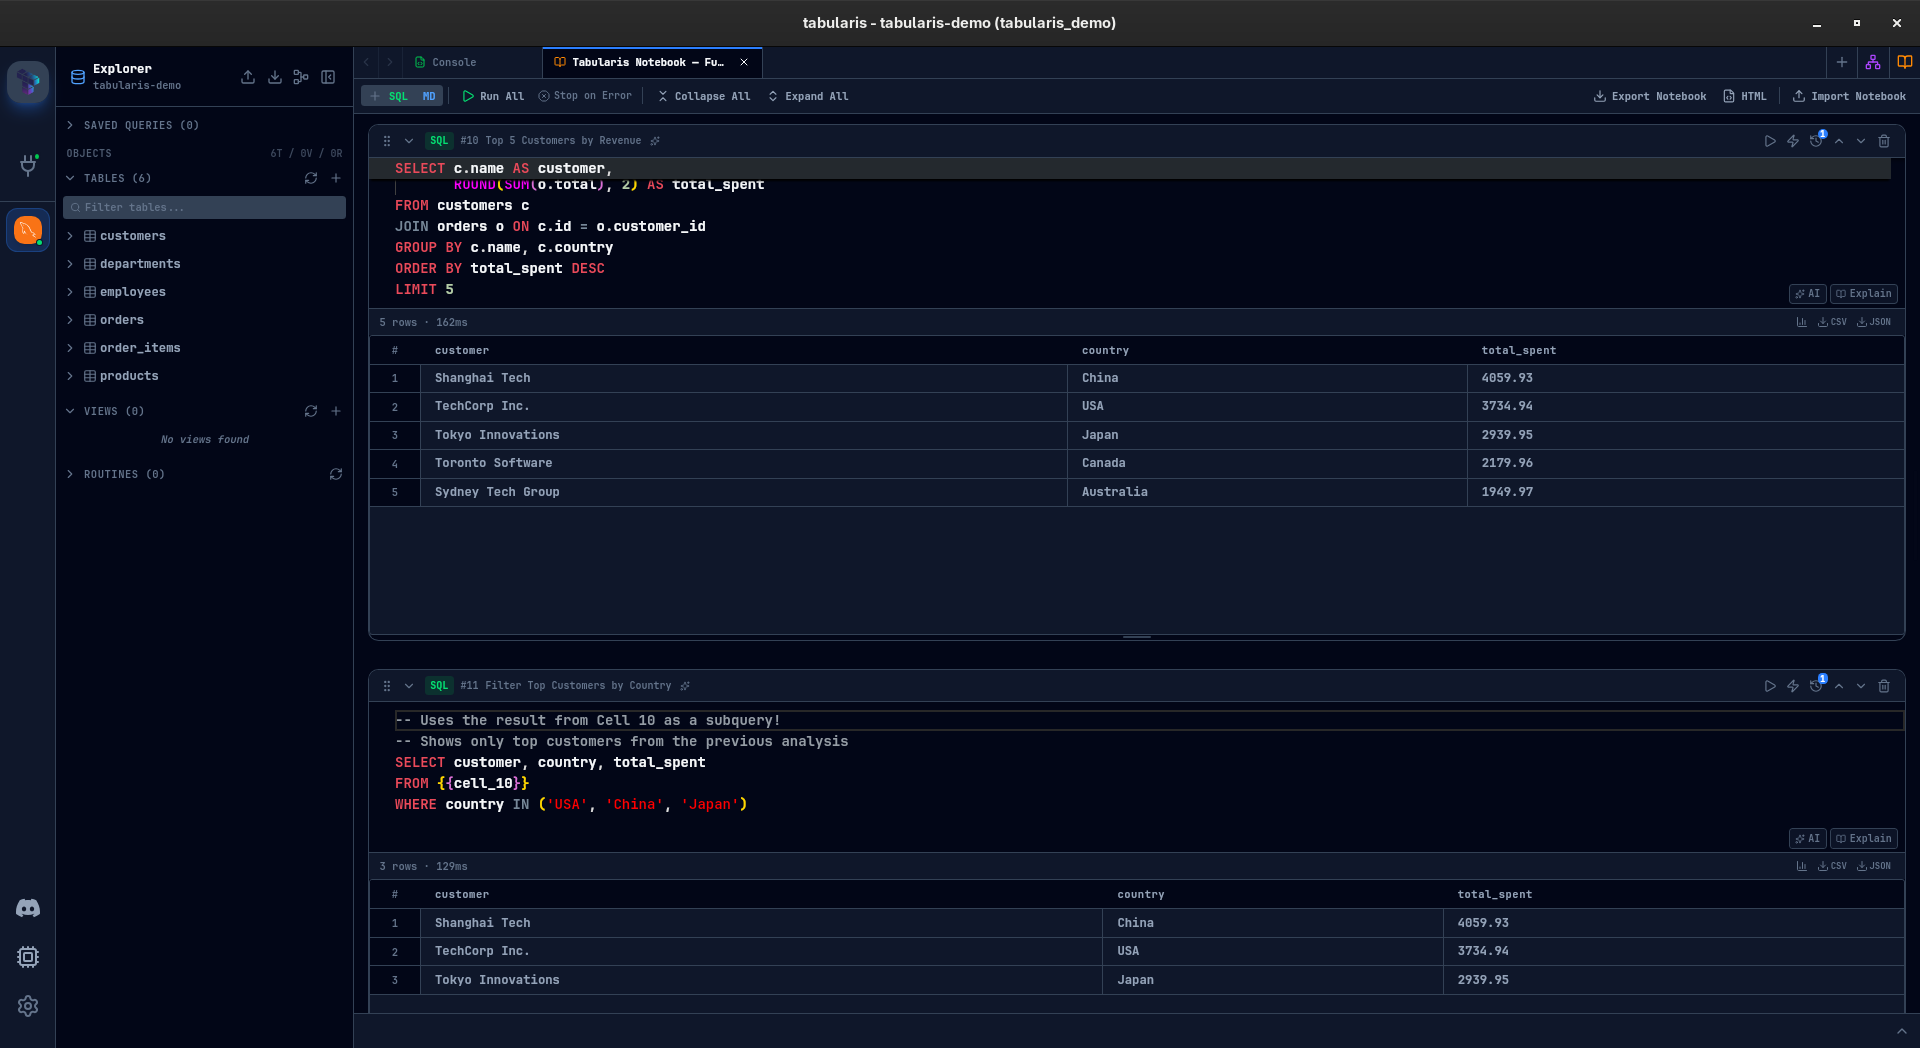
SQL cells can reference another cell's result using {{cell_N}} syntax, where N is the cell's position in the notebook (1-based, counting Markdown cells too). At execution time, {{cell_N}} is expanded into a Common Table Expression (CTE) named cell_N holding the full result of that cell, so you use it like a table. When you run a cell that contains an unresolved reference, the notebook automatically detects the dependency and executes the referenced cell first.
Example:
- The third cell runs
SELECT id, username FROM users LIMIT 10. - A later cell uses
SELECT * FROM orders WHERE user_id IN (SELECT id FROM {{cell_3}}). - When you run that cell, Tabularis detects the dependency, runs cell 3 first (if needed), wraps its result in a
WITH cell_3 AS (...)CTE, and runs your query against it.
This enables building multi-step analytical workflows where each cell builds on the results of previous ones.
Notebook Parameters
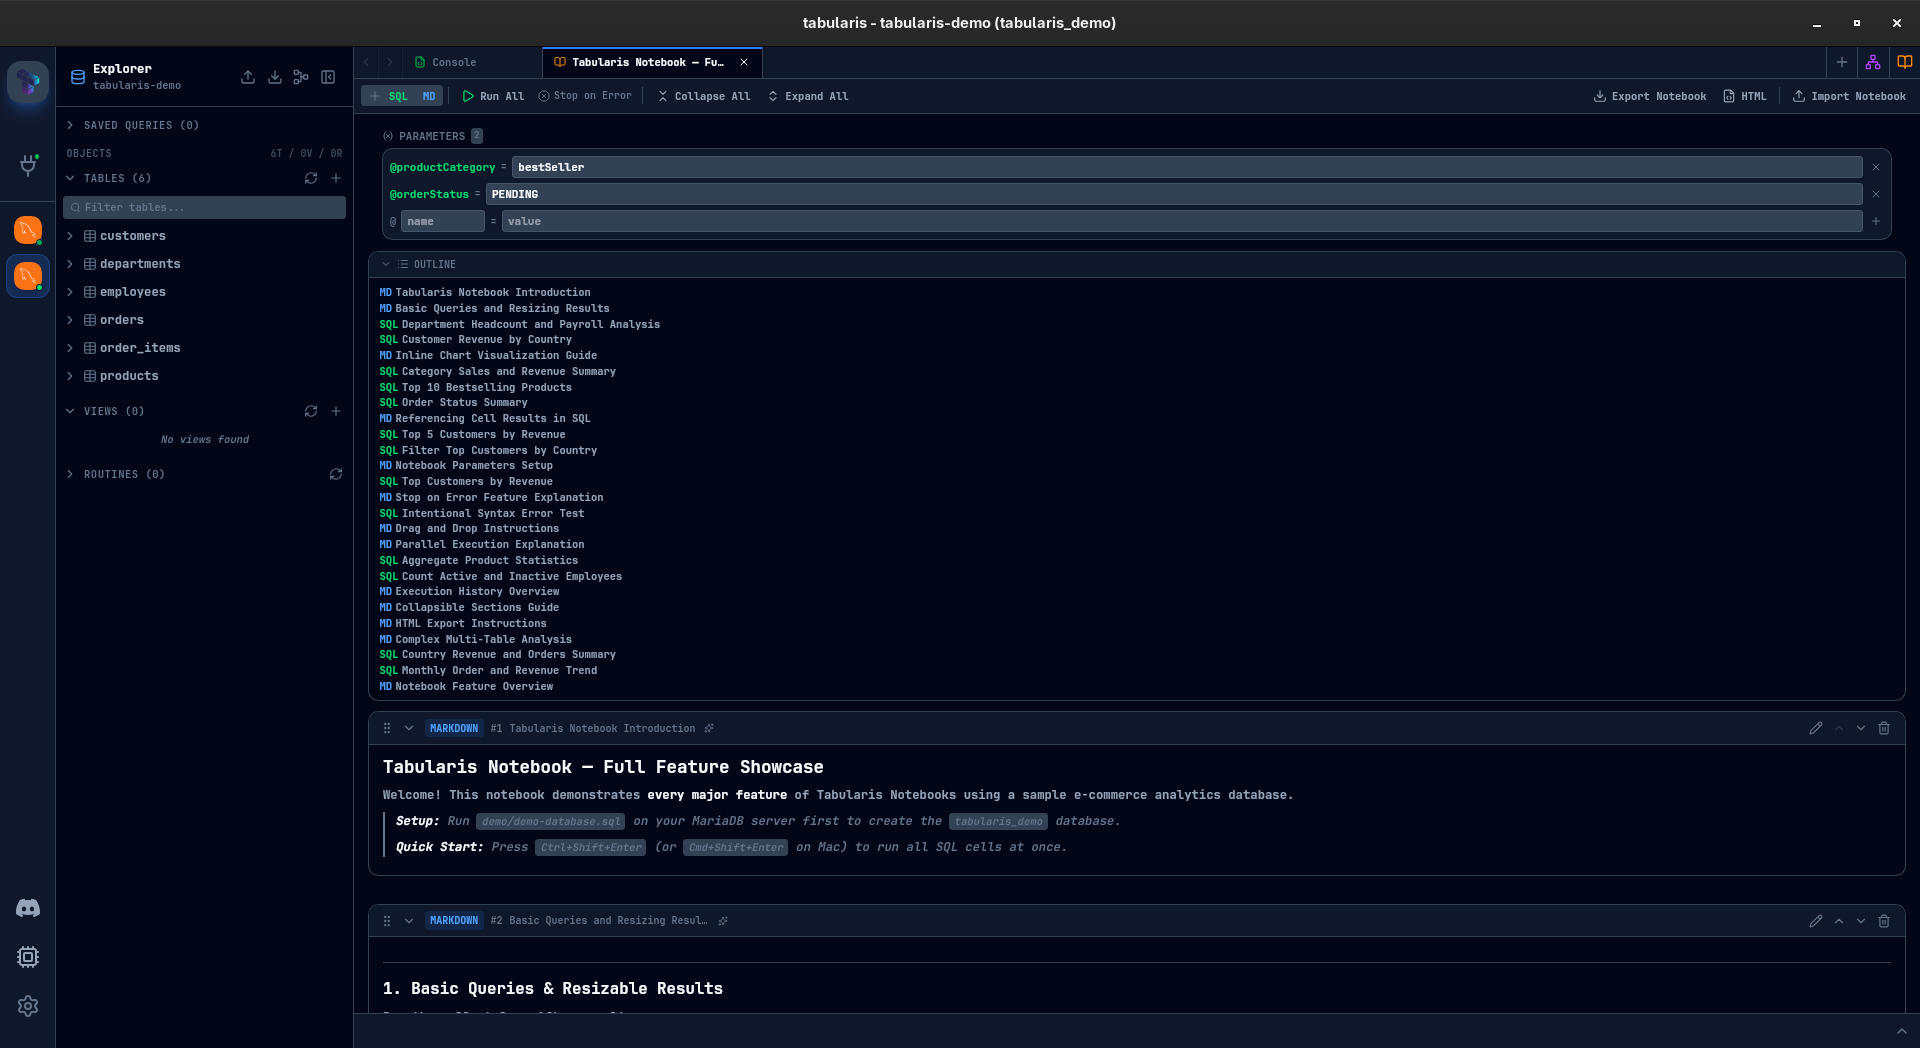
Notebooks support a global parameter system using @paramName syntax. Open the Parameters panel from the toolbar to define name/value pairs. Each @paramName token is substituted with its value across all SQL cells at execution time.
This is useful for:
- Running the same notebook against different date ranges or IDs without editing every cell.
- Sharing notebooks with colleagues who can plug in their own values.

Cell Management
Naming Cells
Double-click the cell name in the header to rename it. Cell names are used in cross-cell variable references and in the outline panel. Unnamed cells show as "Untitled" with a preview of their content.
Reordering
Drag and drop cells to reorder them. Grab the drag handle on the left side of the cell header and move the cell to a new position.
Collapsing
Click the collapse arrow in the cell header to minimize a cell — useful for hiding setup queries you don't need to see while working on later cells. The toolbar provides Collapse All and Expand All buttons for bulk operations.
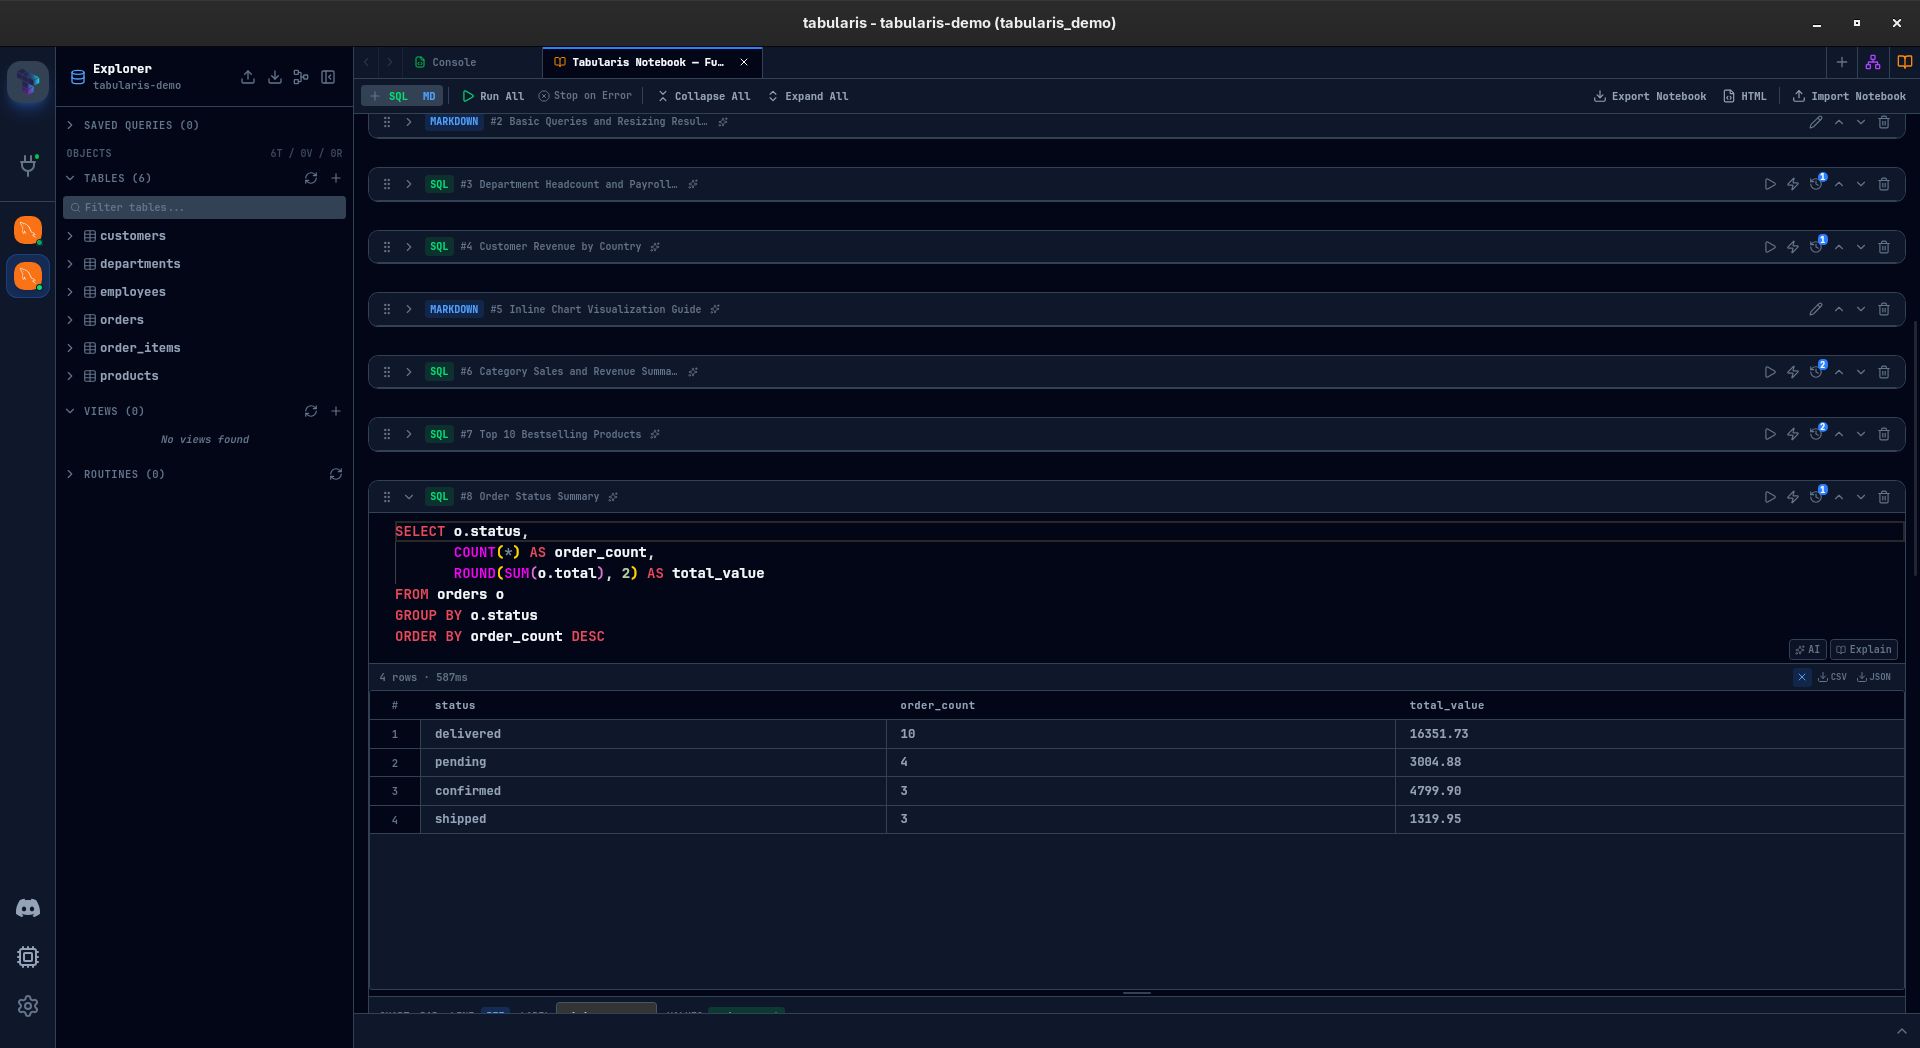
Inside an SQL cell you can also collapse its areas independently — the Query editor, the Results grid, the Chart, and the optional Query Plan — each via a thin labelled header with its own chevron, on top of the master cell collapse. The chart header appears only when the result is chartable. The collapsed state of every section is saved with the notebook, so it persists across reloads, and chart visibility is persisted too (it defaults to whether a chart config already exists, so notebooks created before this change keep showing their charts).
Video unavailable
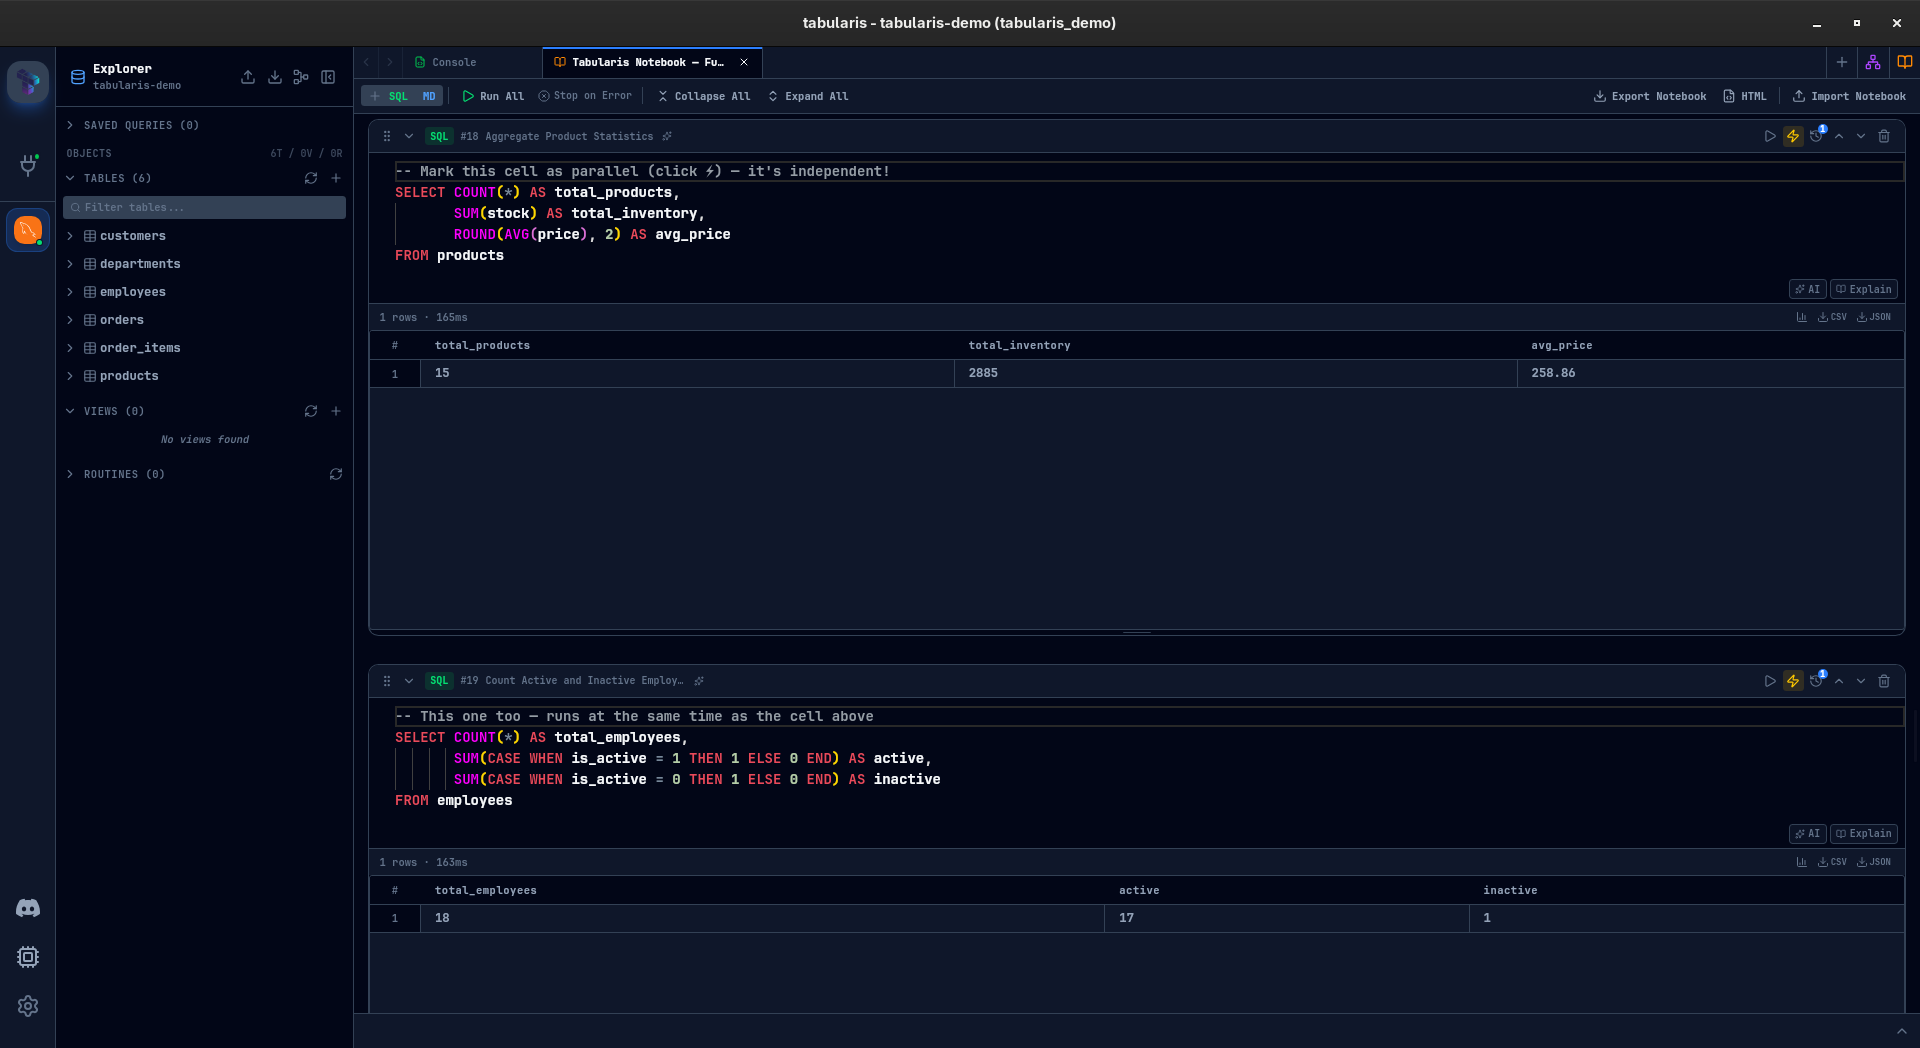
Run All
Click Run All in the notebook toolbar (or press Cmd/Ctrl + Shift + Enter) to execute all SQL cells sequentially from top to bottom. Options:
- Stop on Error — halts execution when a cell fails, skipping remaining cells.
- Summary — after completion, a summary panel shows success/failure/skipped counts with links to any errors.
From the summary, you can also Convert to Console to extract all SQL cells into a single console tab.
Outline
The Outline side panel shows the notebook structure at a glance — every cell listed with its name (or a content preview for unnamed cells). Click any entry to scroll directly to that cell. The outline updates in real time as you add, rename, or reorder cells.
AI Integration
If you have an AI provider configured in Settings, notebooks offer additional capabilities:
- Generate SQL — use the AI overlay to generate SQL from natural language, same as in the regular editor.
- Explain Query — ask the AI to explain the SQL in a cell.
- Cell Naming — click the AI icon on any cell to automatically generate a descriptive name based on its content. Use Name All in the toolbar to batch-generate names for all unnamed cells. The naming prompt is customizable in Settings > AI > Notebook Cell Name Prompt.
Managing Notebooks
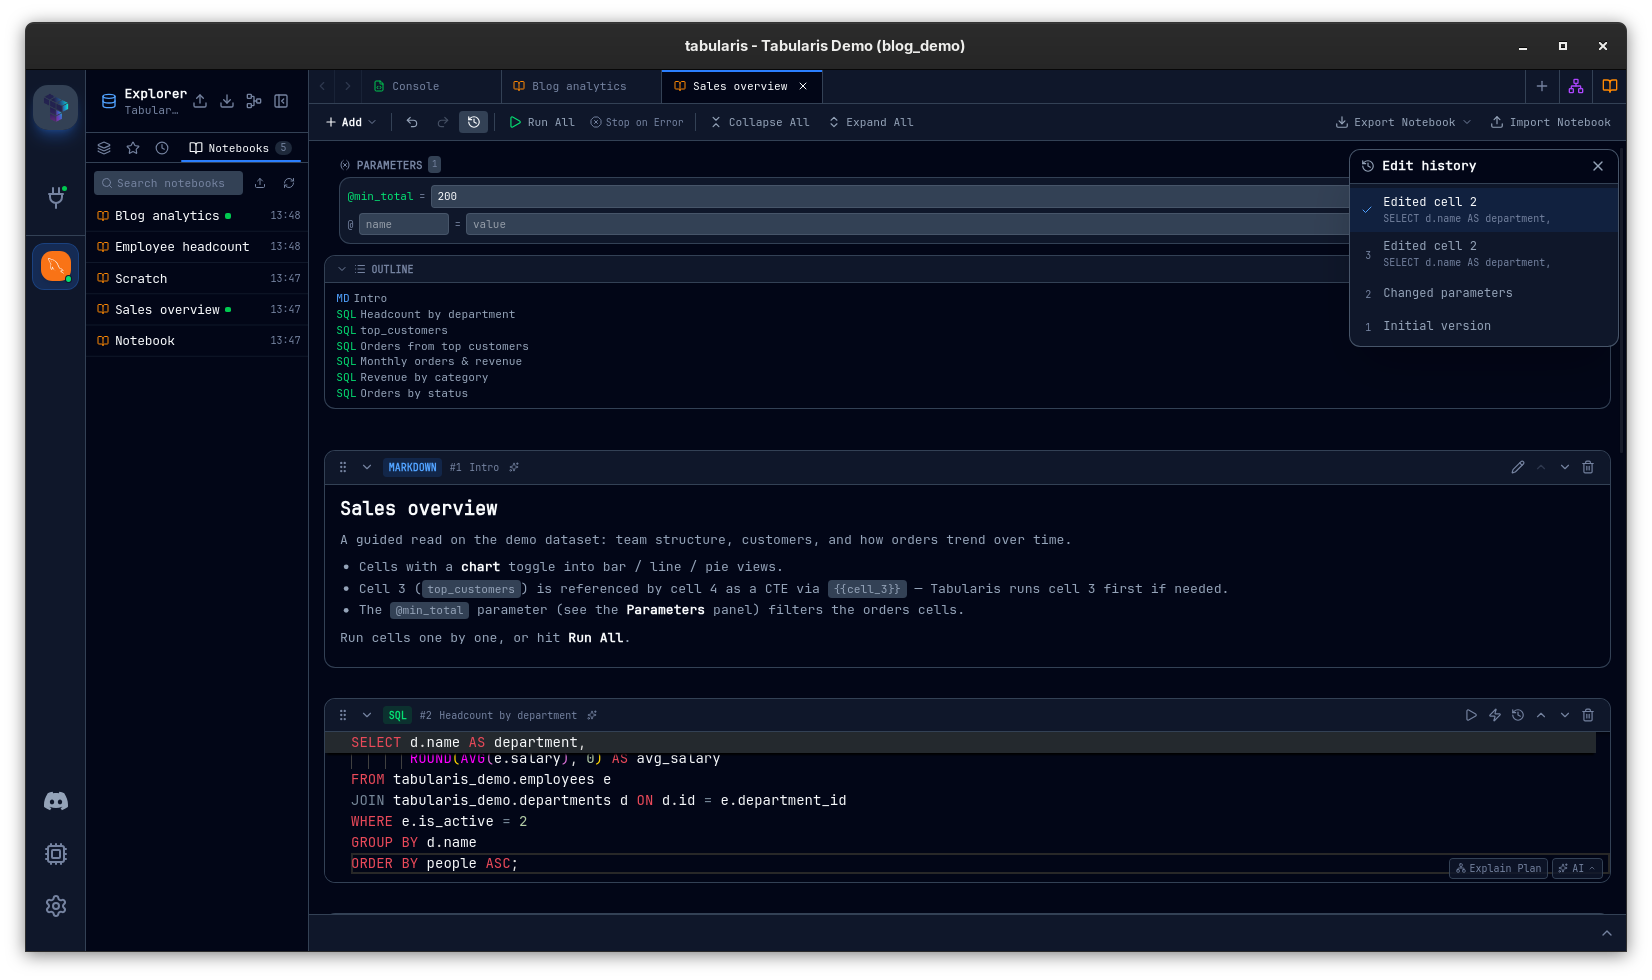
Notebooks are managed from the Notebooks section in the sidebar, which lists the saved notebooks for the active connection. From here you can:
- Search the list by name.
- Open a notebook with a single click.
- Use the context menu to rename, export, import, delete (with confirmation), or Save as HTML.
The list refreshes live — creating a notebook adds it immediately, and renames or deletions reflect without a manual reload. You can also rename a notebook directly from its editor tab by double-clicking the title.
Edit History
Notebook editing is undoable. Every structural change — adding, removing, reordering, or editing cells — is captured into a timeline. Open the history panel to scrub back through previous states and jump to any point; each entry is labeled by what changed.
Persistence
Notebooks are saved automatically to disk in the app config directory (JSON format), organized per connection under notebooks/<connectionId>/<notebookId>. Legacy flat notebooks from older versions are migrated automatically the first time their connection loads. Saving is debounced — changes are written after you stop editing, not on every keystroke.
| Platform | Path |
|---|---|
| macOS | ~/Library/Application Support/tabularis/notebooks/ |
| Linux | ~/.config/tabularis/notebooks/ |
| Windows | %APPDATA%\tabularis\notebooks\ |
Import & Export
Notebook format
Export a notebook as a .tabularis-notebook file to share with colleagues. Import via the toolbar button — the file is loaded into a new notebook tab with all cells, names, and parameters preserved.
HTML Export
Click Export as HTML to generate a standalone HTML document containing all cells, their results, and rendered Markdown. This is useful for sharing findings with non-technical stakeholders or archiving completed analyses.
CSV / JSON
Individual cell results can be exported to CSV or JSON using the result toolbar, same as in the regular data grid. Since v0.24.0, exports report success or a write error; cancelling the file picker produces neither.
Keyboard Shortcuts
| Action | macOS | Windows / Linux |
|---|---|---|
| Run current cell | Cmd + Enter |
Ctrl + Enter |
| Run All cells | Cmd + Shift + Enter |
Ctrl + Shift + Enter |