AI Audit Log
Every tool call your AI agent makes through the Tabularis MCP server gets recorded. The audit log gives you three things:
- Forensics — exactly which agent ran which query against which database, when, and what came back.
- Replay — turn an entire AI session into a
.tabularis-notebookand re-run it cell by cell. - A direct line into Visual Explain — one click on any
run_queryrow opens the Visual Explain modal with the query already loaded.
All of this is local. Nothing about your queries leaves your machine.
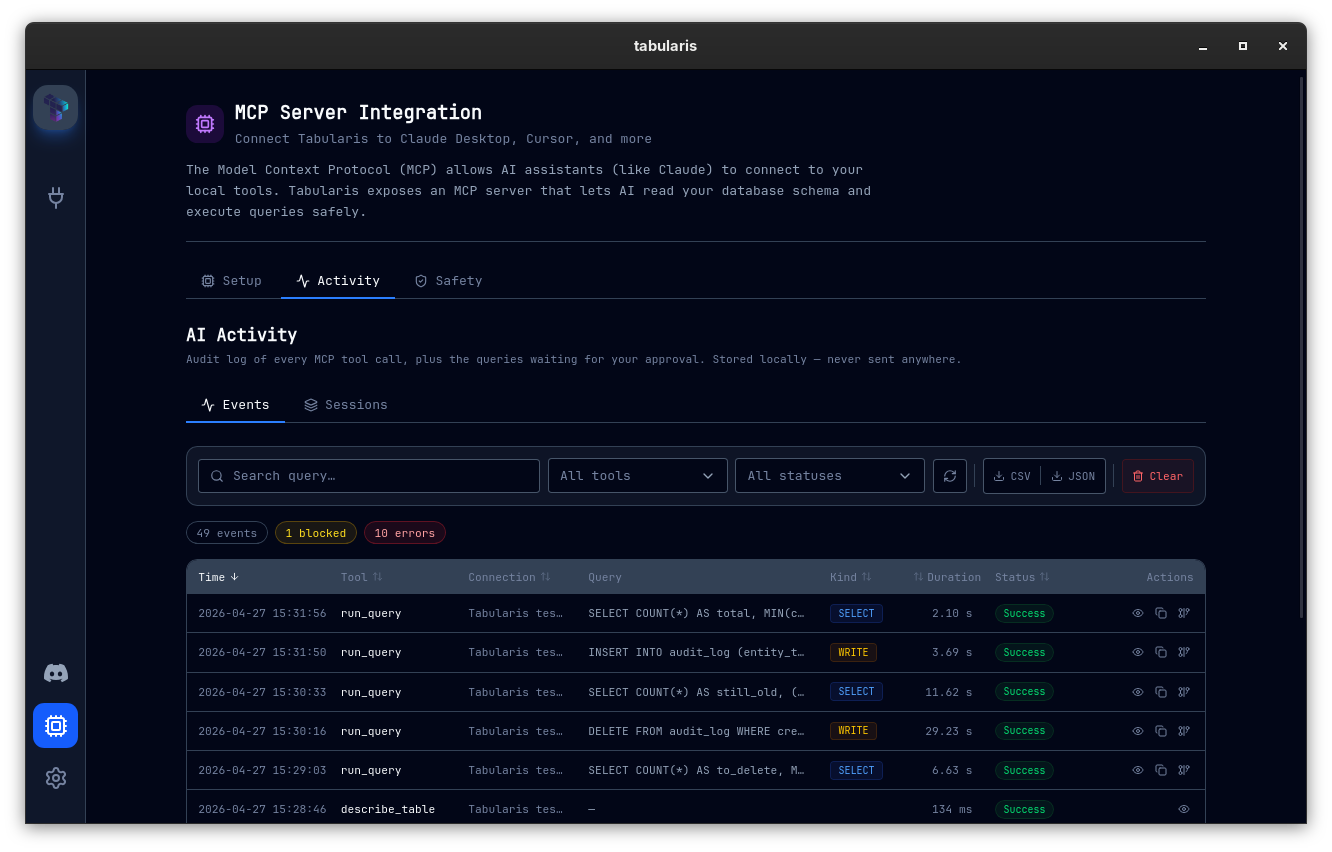
Where to find it
MCP → Activity (the plug icon in the sidebar opens the MCP page; the Activity tab hosts the audit log). Two sub-tabs:
- Events — flat table of every MCP tool call with filters and exports.
- Sessions — same data grouped by session, with a "Export as Notebook" button per session.
What gets recorded
For every tools/call MCP request, Tabularis writes one line to the audit log with:
| Field | Notes |
|---|---|
id |
UUID v4 for the event itself. |
sessionId |
UUID v4 grouping events from the same agent burst (see Sessions below). |
timestamp |
ISO 8601, UTC. |
tool |
list_connections · list_tables · describe_table · run_query. |
connectionId / connectionName |
The connection the call hit (null for list_connections). |
query |
Full SQL text — only for run_query. |
queryKind |
select · write · ddl · unknown. Conservative: anything ambiguous → unknown. |
durationMs |
Wall time the MCP server spent on the call. |
status |
success · blocked_readonly · denied · timeout · error. |
rows |
Returned/affected row count when applicable. |
error |
Failure message — verbatim from the driver. |
clientHint |
What the agent told us in initialize — usually claude-desktop, cursor, etc. |
approvalId |
Set when the call went through the approval gate. |
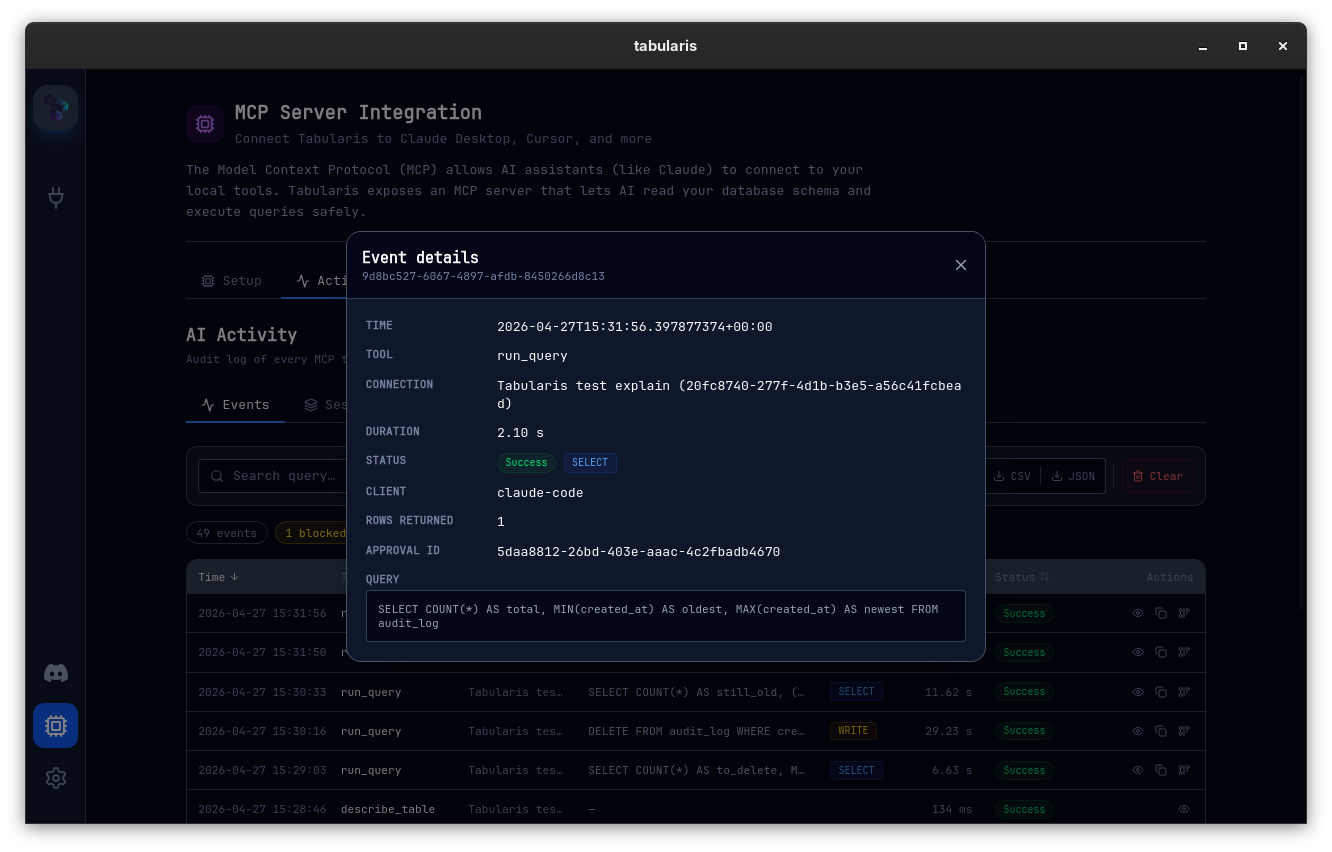
Clicking any row opens the Event details modal with the full record — including the complete query text, the originating client, and the approval id when present.
Sessions
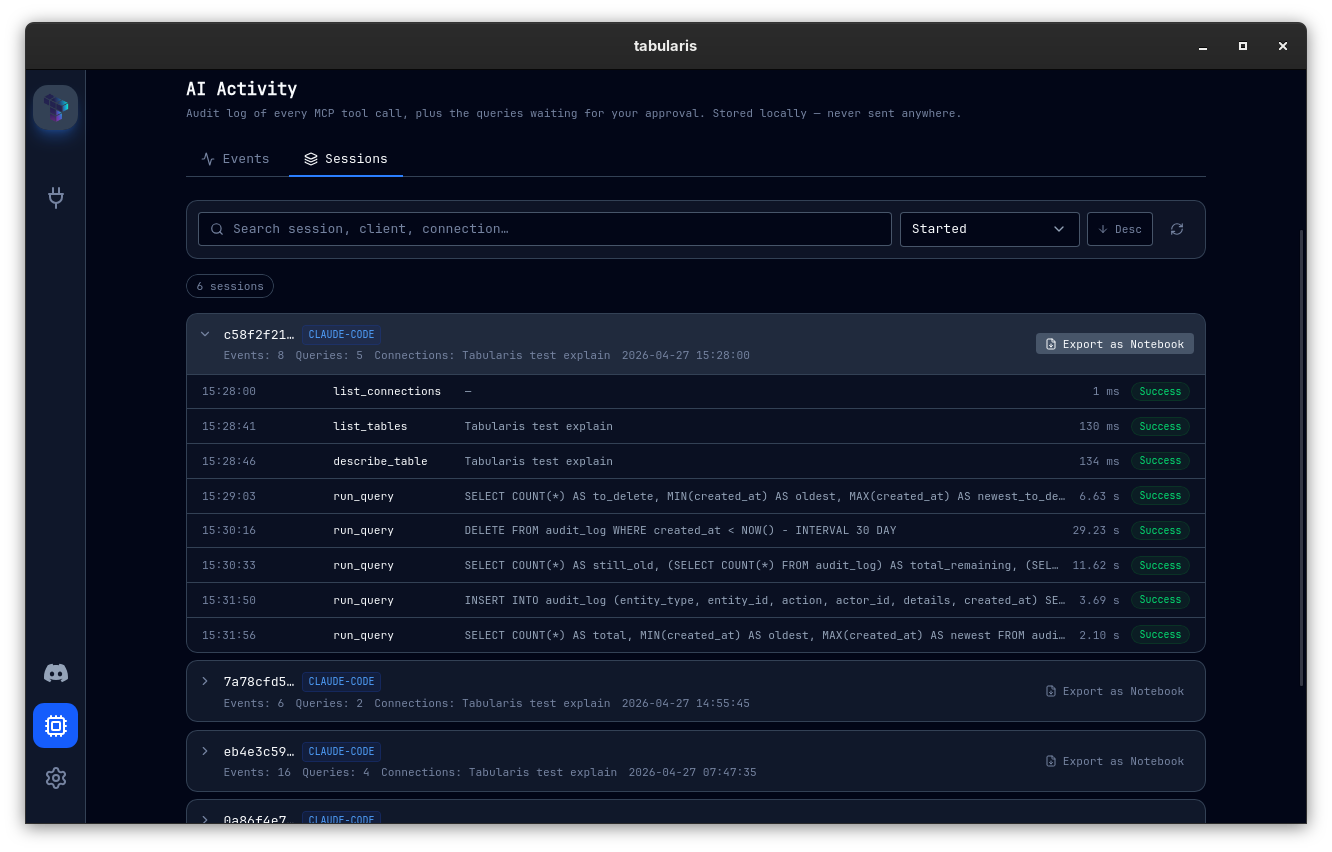
A session is a contiguous burst of activity from the same MCP client. The session id rotates whenever there's a quiet gap longer than aiSessionGapMinutes (default: 10 minutes) between two tool calls. This makes it easy to look back at "what did Claude do for me yesterday afternoon" without scrolling through thousands of unrelated events.
Each session card shows:
- Client name (
claude-desktop,cursor,windsurf, …) - Connections touched
- Event count + run_query count
- Start/end timestamps
- An Export as Notebook button
Export as Notebook
Click Export as Notebook on any session and Tabularis builds a valid .tabularis-notebook:
- A markdown header cell with the session metadata (client, connections, event count, time range).
- One SQL cell per
run_queryevent, in chronological order. Cell names are derived from the first--comment in the query when present, orQuery Notherwise. - Markdown context cells for
list_tables/describe_tablecalls so you keep the agent's investigation trail.
Results are intentionally not embedded — opening the notebook re-executes the cells against the live database. This matches how every other notebook in Tabularis behaves.
This is the easiest way to:
- Send a colleague the exact sequence of queries an agent generated for review.
- Diff "what the agent thought it was doing" vs. "what actually changed".
- Keep a reproducible record of an investigation alongside a PR.
Open in Visual Explain
Every run_query row in the Events tab has an Open in Visual Explain icon. Clicking it opens the same Visual Explain modal you get from the query editor, with the query and connection already populated. EXPLAIN runs immediately. Useful when you spot a slow query in the log and want to know why.
Storage and rotation
The log lives at:
~/.config/tabularis/ai_activity.jsonl
(Equivalent app-config dir on macOS and Windows.)
It's append-only JSON Lines — one event per line, written atomically. When the active file reaches aiAuditMaxEntries (default 5,000) it gets rotated to ai_activity.1.jsonl, the previous archives shift down, and the oldest (ai_activity.5.jsonl) is dropped. The Events tab reads across all five archive files plus the active one, so the rotation is invisible to you.
You can clear the entire log from the panel (Clear button — confirmation required), or export everything as JSONL or CSV before clearing.
Configuration
All settings can be edited from the UI (MCP → Activity + MCP → Safety) or directly in config.json:
{
  "aiAuditEnabled": true,
  "aiAuditMaxEntries": 5000,
  "aiSessionGapMinutes": 10
}
Set aiAuditEnabled to false to turn the log off entirely; the MCP server then runs the original code path with zero overhead.
Privacy considerations
The log captures full SQL text. If your queries embed parameter values (which they often do when generated by an agent), those values will be on disk. The log is local-only — Tabularis never uploads it — but treat the file as you would ~/.bash_history: it can contain credentials or PII if your queries do.
A future release will add optional query masking (parameter placeholders only). Until then, Clear wipes the entire history with one click.