Schema Management & ER Diagrams
While knowing how to write ALTER TABLE statements is essential, Tabularis provides visual tools to manage your schema quickly, safely, and comprehensively.
Visual Schema Editor
The left sidebar is a fully interactive management suite. Right-click any table to enter the Schema Editor.
Modifying Structures
- Columns: Add, rename, or drop columns. Change data types using a searchable type picker — start typing to filter the full list of available types for your database engine.
- Constraints: Visually toggle
NOT NULL,UNIQUE, andPRIMARY KEYconstraints. Set default values with a simple text input. - Indexes: Manage b-tree, hash, or spatial indexes to optimize query performance.
- Foreign Keys: Define relationships. Select the target table and column, and specify cascading rules (
ON DELETE CASCADE,ON UPDATE RESTRICT).
Auto-Increment Handling (PostgreSQL)
When creating or modifying a column with auto-increment enabled, Tabularis automatically selects the correct serial type based on the column's integer type:
| Integer type | Serial type |
|---|---|
SMALLINT |
SMALLSERIAL |
INTEGER |
SERIAL |
BIGINT |
BIGSERIAL |
Enabling auto-increment forces NOT NULL and clears any default value, matching PostgreSQL's native serial behavior.
Extension-Aware Column Types (PostgreSQL)
The type picker includes types from popular PostgreSQL extensions — hstore, ltree, citext, PostGIS (geometry, geography), and more. When you select one of these types, Tabularis tracks which extension is required so you can verify the extension is enabled on the target database before applying the DDL.
Safe DDL Generation
When you make visual changes, Tabularis does not apply them blindly. It compiles your actions into a set of precise DDL (CREATE, ALTER, DROP) statements and presents them in a preview window. You can review the exact SQL that will run, copy it for version control migrations, or click "Apply" to execute it.
Generate SQL
Right-click any table in the sidebar and choose Generate SQL to open a modal with ready-made statements for that table. Starting with v0.13.0, the modal is organized into tabs:
| Tab | Generates |
|---|---|
| CREATE TABLE | The full DDL for the table |
| SELECT * | A select-all query |
| SELECT [fields] | A select with every column listed explicitly |
| UPDATE | An update template with every column, using :named bind parameters derived from the column names |
| DELETE | A delete template |
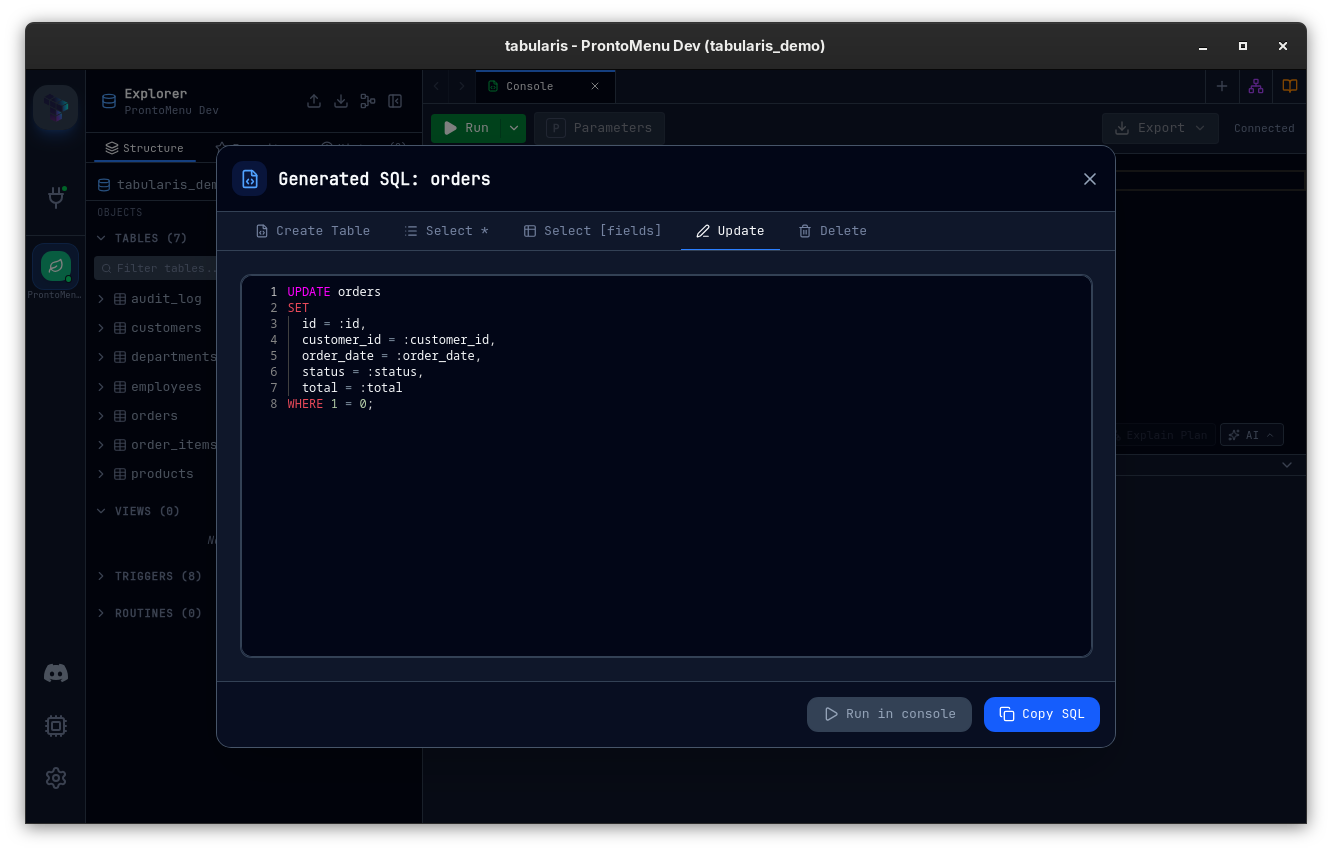
Each tab has a copy button, and the Run in Console button opens the generated statement in a new editor tab. The UPDATE template uses :named parameters instead of bare ? placeholders, so it binds correctly the moment it lands in the query editor.
The modal is also reachable from the Quick Navigator's hover actions.
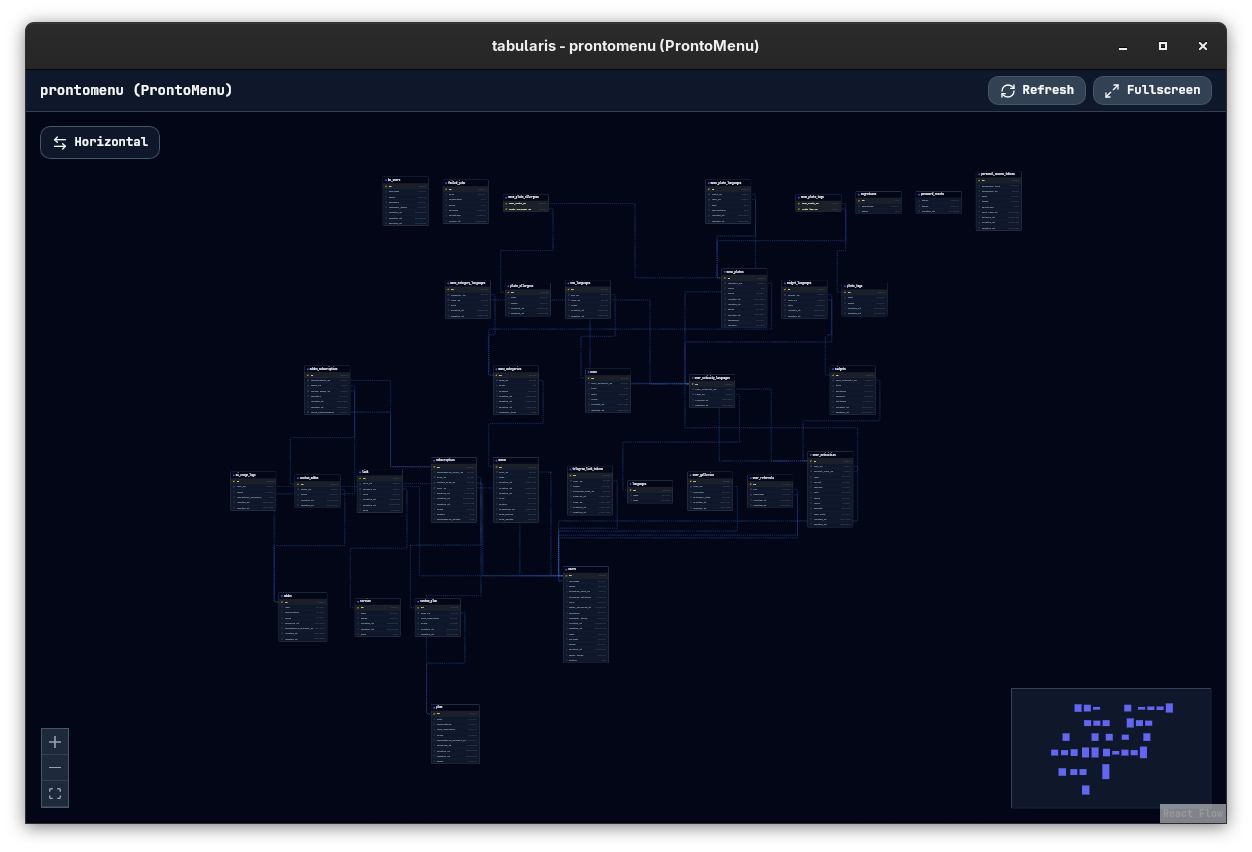
ER Diagrams
Right-click any database or schema in the sidebar and choose Open ER Diagram to open a live, interactive entity-relationship diagram for that schema. Tables appear as nodes, foreign keys as directed edges. The layout is computed automatically using the Dagre engine.
For full details — navigation, layout options, export, and per-driver FK support — see the dedicated ER Diagram page.