Task Manager
The Task Manager is a built-in system monitor focused on Tabularis itself and the plugin processes it spawns. It lets you see resource consumption at a glance and take direct action — restart a misbehaving plugin or force-kill it — without leaving the application.
Open it from Settings → Plugins, using the Open Task Manager button in the Task Manager section.
Interface Overview
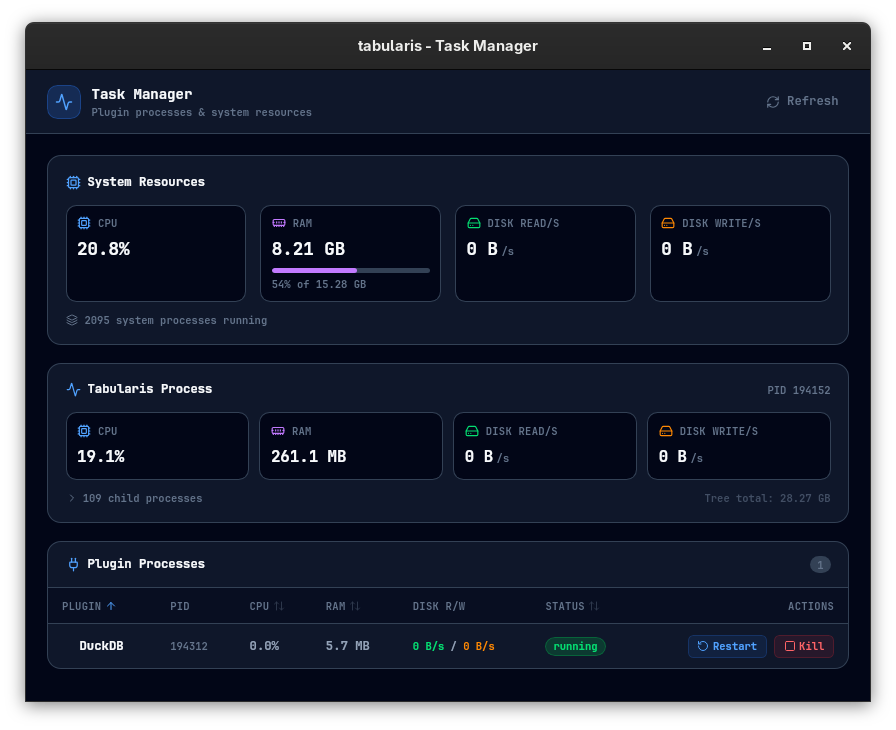
The Task Manager window is divided into three panels:
1. System Resources
A real-time summary of the host machine:
| Metric | Description |
|---|---|
| CPU | Total CPU usage across all cores |
| RAM | Used memory with a visual bar (used / total) |
| Disk Read/s | Aggregate read throughput |
| Disk Write/s | Aggregate write throughput |
A process count is also shown at the bottom of this panel.
2. Tabularis Process
Stats for the Tabularis process itself (the Tauri/Rust backend):
| Metric | Description |
|---|---|
| CPU | CPU usage of the main process |
| RAM | Memory consumed by the main process |
| Disk Read/s | Read I/O rate |
| Disk Write/s | Write I/O rate |
| PID | Operating system process ID |
If Tabularis has spawned child processes (e.g., WebView2 on Windows), you can expand the row to see each child's PID, name, CPU, and RAM.
3. Plugin Processes
A sortable table of all active plugin driver processes. Each row represents one running plugin.
Columns:
| Column | Description |
|---|---|
| Plugin | Plugin name (with child process count if any) |
| PID | OS process ID |
| CPU | CPU usage percentage |
| RAM | Resident memory usage |
| Disk R/W | Read and write throughput |
| Status | running, stopped, or other states |
| Actions | Restart / Kill buttons |
Click any column header to sort by that column. Click again to reverse the sort order.
If a plugin has spawned sub-processes (e.g., a language runtime), expand the row with the chevron to inspect each child process individually.
Actions
Restart a Plugin
Click Restart on any plugin row. Tabularis will send a stop signal to the process and re-launch it from the same manifest. Active queries through that plugin will be interrupted.
Kill a Plugin
Click Kill to force-terminate a plugin immediately. A confirmation modal appears before the action is executed to prevent accidental kills. The plugin process will not be restarted automatically.
Refresh
Click the Refresh button in the top-right corner to fetch a fresh snapshot of all stats. The page does not auto-refresh to avoid constant background polling.
When to Use It
- A plugin is consuming unexpected amounts of CPU or memory.
- A plugin has crashed and is stuck in a non-running state.
- You want to reclaim resources from plugins you aren't actively using without uninstalling them.
- You need to find the PID of a plugin subprocess to attach an external debugger.
Notes
- The Task Manager only shows plugin processes in the plugin table. Native drivers (PostgreSQL, MySQL, SQLite) run inside the Rust backend and do not appear as separate processes.
- Killing a plugin does not uninstall it. It will be available again next time you open a connection that uses that driver.
- On Linux, disk I/O stats require the process to have sufficient permissions to read
/proc.