

ER Diagram
The ER Diagram viewer generates a live, interactive entity-relationship diagram directly from your database schema. Tables appear as nodes; foreign key relationships appear as edges connecting them. The layout is computed automatically using the Dagre graph layout engine.
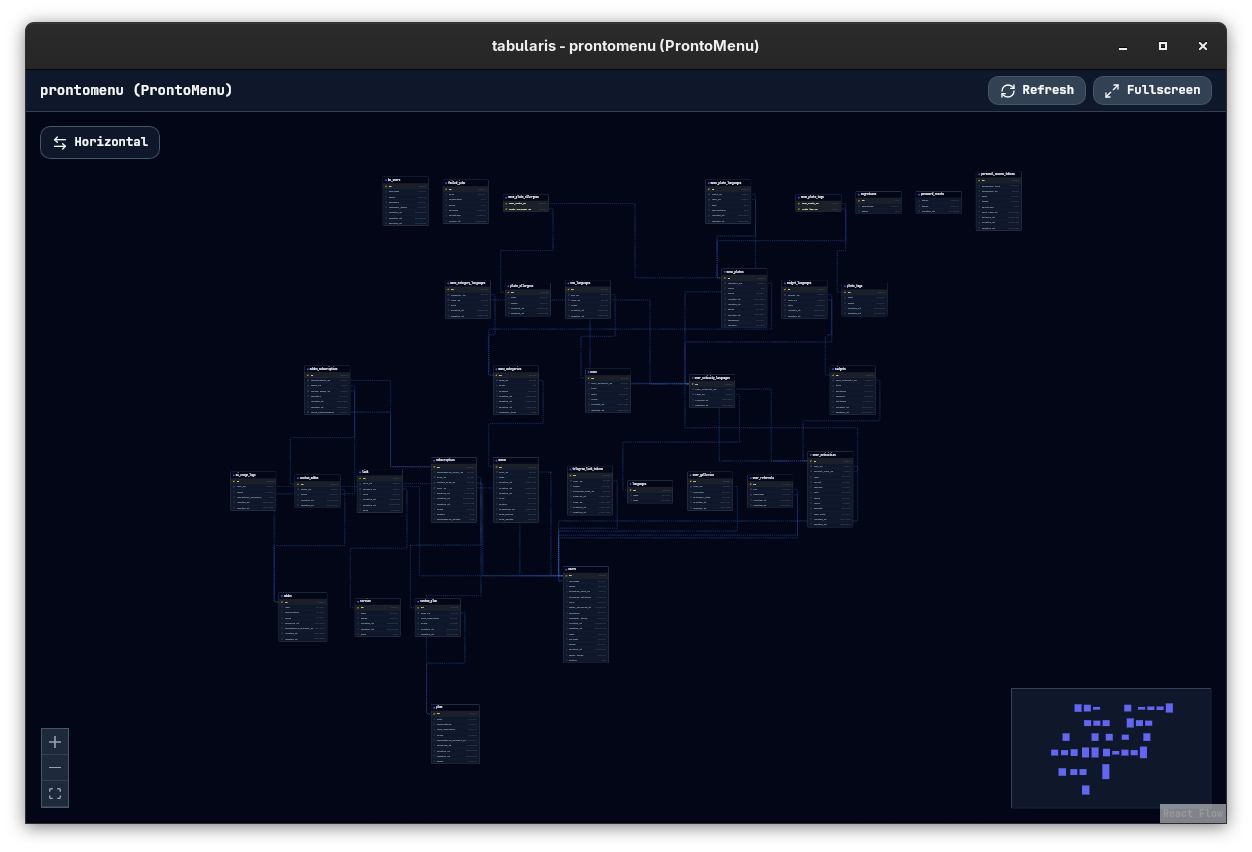
Opening the ER Diagram
The diagram opens in a new window dedicated to the connection and schema. You can open it from:
- View Schema Diagram in the Explorer header's actions menu, for the active schema.
- View ER Diagram in the context menu of a database (on connections that show several databases), or the diagram icon on its row.
- View ER Diagram in a table's context menu, which opens the diagram focused on that table.
Interface
The diagram window has a minimal header with:
- Connection / Database / Schema — shown at the top so you always know which schema you're viewing.
- Refresh button — reloads the schema and redraws the diagram. Schema data is cached for five minutes, so a refresh within that window may show the cached structure.
- Fullscreen toggle — expands the diagram to fill the entire display. Press
Escto exit.
Nodes
Each table is a node showing:
- Table name (header)
- Column list with data types
- Primary key indicator
- Foreign key indicator (columns that participate in a relationship)
Edges
Foreign key constraints are drawn as directed edges from the referencing column to the referenced table. The direction follows the FK definition — the arrow points from the child (referencing) table to the parent (referenced) table.
Navigation
| Action | Result |
|---|---|
| Scroll wheel | Zoom in / out |
| Click + drag (on canvas) | Pan the view |
| Click + drag (on a node) | Move the node, once nodes are unlocked (see Lock node positions below) |
+ / - |
Zoom in / out |
| Click (on a table) | Focus on that table: only it and its directly related tables stay visible. Click it again, or Show All, to see every table |
| Right-click (on a table) | Focus on Table |
While a table is focused, a Focused on badge shows its name. A minimap appears in the corner when 10 to 100 tables are on screen.
Layout Options
Tabularis supports two Dagre layout directions. The default is set in Settings → General → Default Layout:
| Setting | Description |
|---|---|
TB (Top-Bottom) |
Tables are laid out from top to bottom — works well for tall schemas with many relationships. |
LR (Left-Right) |
Tables flow left to right — better for wide schemas with fewer levels. |
The setting is stored as erDiagramDefaultLayout in config.json. To switch direction for the open diagram only, use the Vertical / Horizontal toggle in the diagram toolbar.
Refreshing the Schema
The ER Diagram reads the schema at the time you open it. If you modify tables (add columns, create foreign keys) while the diagram is open, click Refresh to reload the schema and redraw the diagram. Refresh goes through the 5-minute schema cache, so changes made shortly after the schema was last loaded may only appear once the cache expires.
Supported Relationships
| Database | FK Support |
|---|---|
| PostgreSQL | Full — FK constraints of the schema are read from pg_constraint. A foreign key that points to a table in a different schema is not drawn, because only tables of the current schema are on the canvas. |
| MySQL / MariaDB | Full — FK constraints from information_schema.KEY_COLUMN_USAGE and REFERENTIAL_CONSTRAINTS. |
| SQLite | Full — declared FK constraints are read with PRAGMA foreign_key_list, whether or not PRAGMA foreign_keys enforcement is on. |
| Plugin drivers | Depends on the plugin: the diagram loads tables, columns and foreign keys through the plugin's get_schema_snapshot method. |
Export
Since v0.18.0 the toolbar has an Export button offering two text formats, both generated from the schema data already in memory:
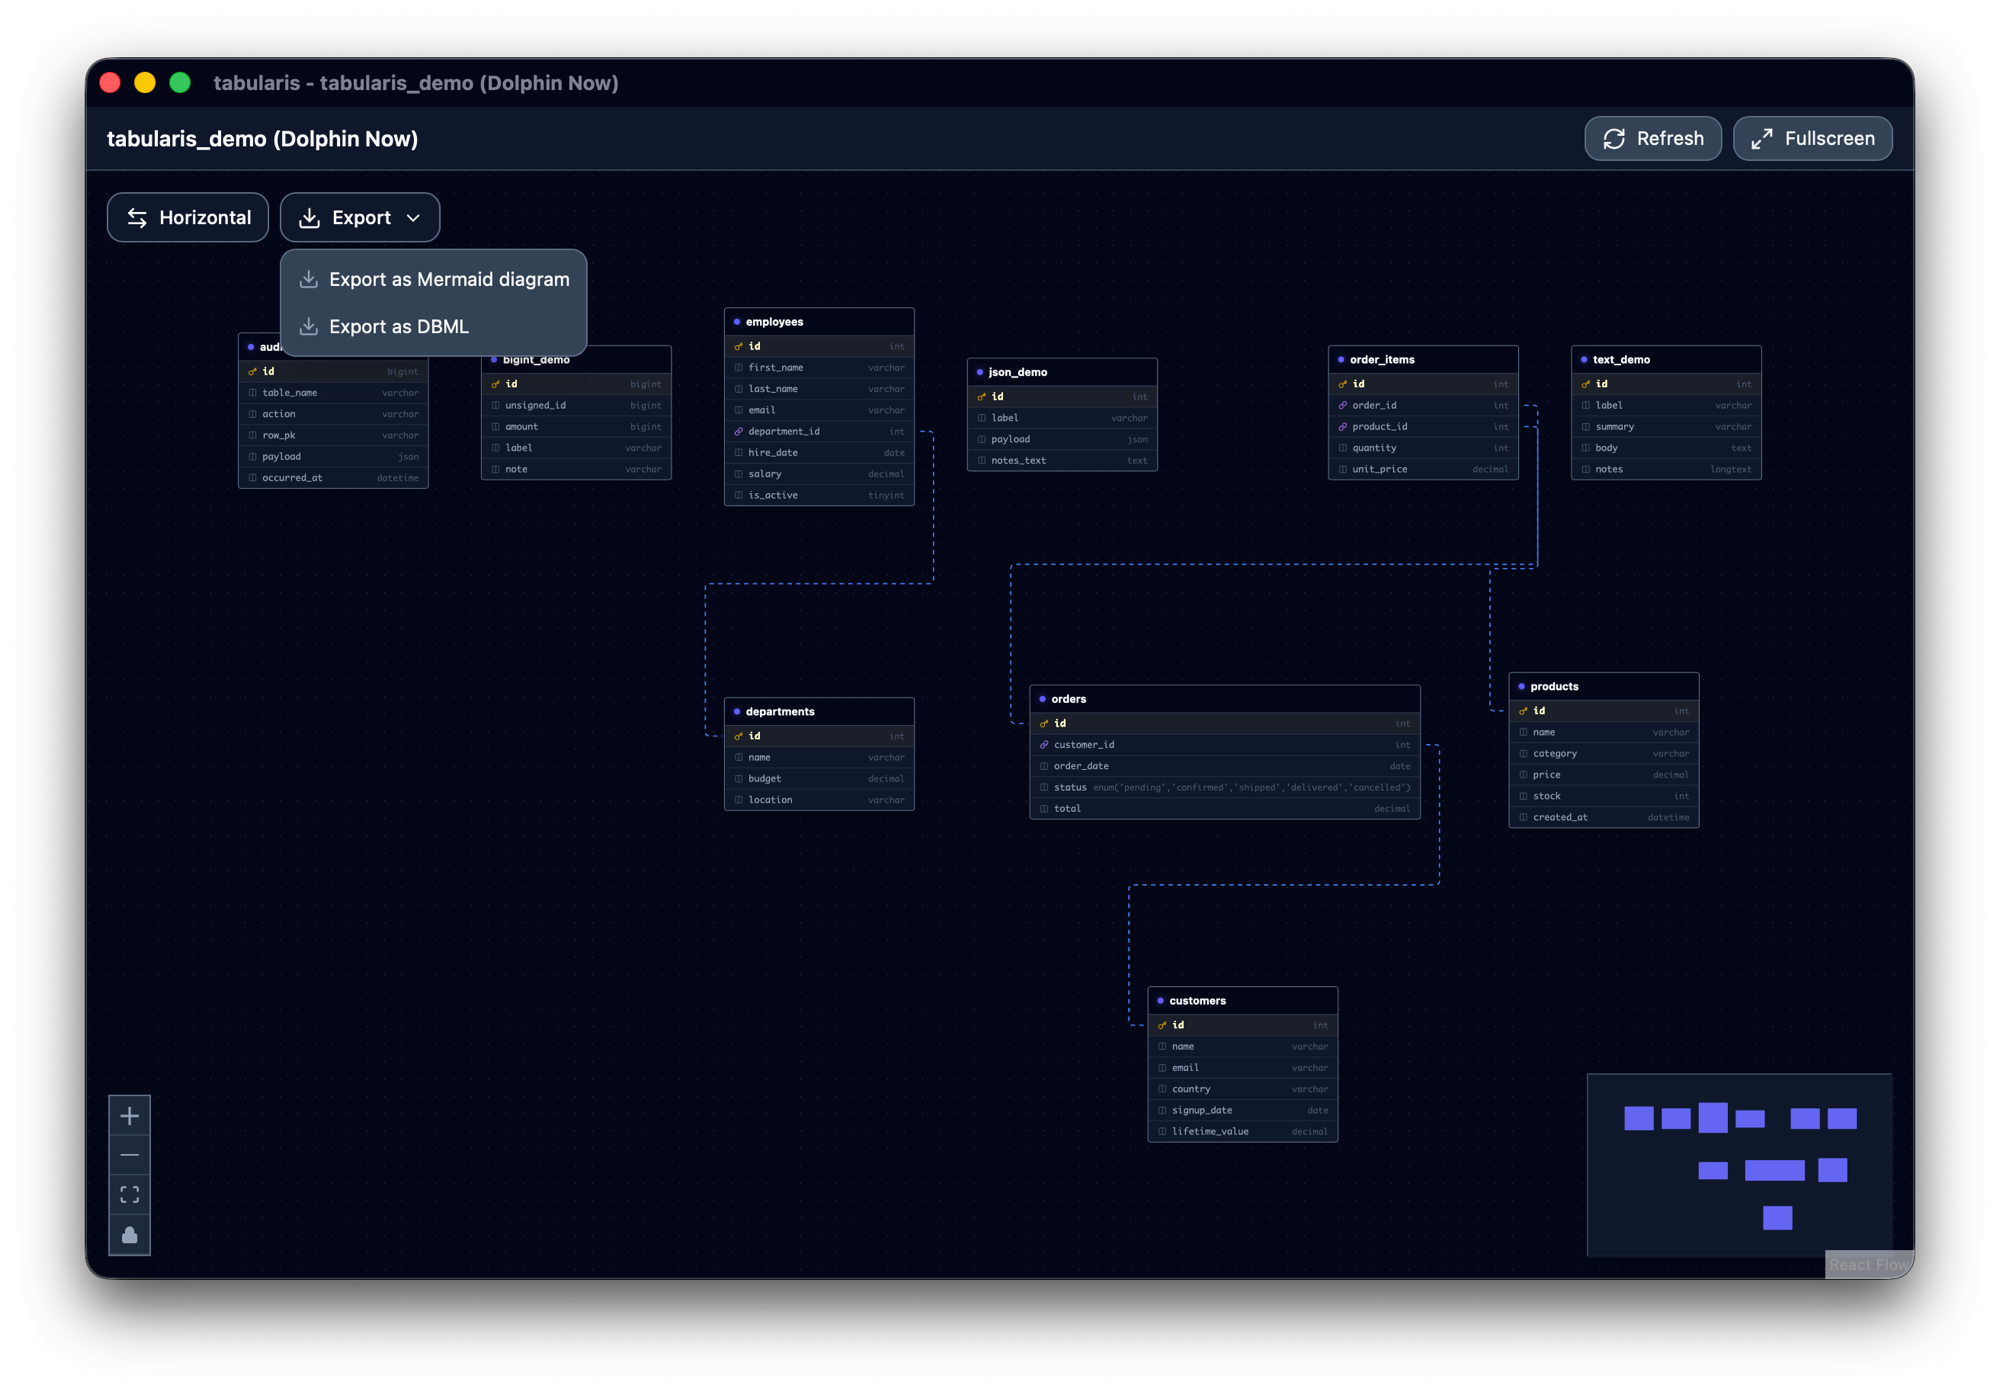
| Format | What it is good for |
|---|---|
Mermaid (erDiagram) |
Renders natively on GitHub, GitLab, Notion and most documentation tools, so the output can be pasted straight into a README. Relationships are entity-level, so the foreign-key column appears only as an edge label. |
| DBML | Keeps relationships at column level (Ref: orders.client_id > clients.id) and round-trips through dbdiagram.io and dbml-to-sql. Composite primary keys are expressed with an Indexes block, since inline [pk] cannot represent them. |
To save the diagram as an image instead, take a screenshot of the window — Cmd + Shift + 4 on macOS, Win + Shift + S on Windows, or your desktop environment's tool on Linux. Fullscreen mode first gives a larger, cleaner capture.
Notes
- The ER Diagram opens in a separate window. You can keep it open alongside the main Tabularis window while working in the SQL editor.
- For very large schemas (100+ tables), the initial layout may take a moment to compute. Dragging nodes manually after the initial render is a good way to organize dense clusters.
- Node positions are not persisted — each time you open the diagram, Dagre recalculates the layout from scratch.
- Nodes are locked by default, so panning and zooming cannot nudge them out of place. Click the lock icon in the zoom controls (tooltip Unlock nodes to move them) before dragging a node, and click it again (Lock node positions) to freeze them.
- Since v0.18.0 the layout estimates each node's real rendered width and height from its content instead of assuming a fixed width, so wide tables — a column with a long
enum(...)definition, for example — no longer overlap their neighbours.