Notebooks: SQL Analysis, Reimagined

Every database client has a query editor. You write SQL, you run it, you see a table. If you need to build on that result, you copy-paste it into the next query. If you need a chart, you export to CSV and open a spreadsheet. If you want to document your analysis, you paste queries into a Notion doc and hope nothing drifts out of sync.
I have been doing this for years, and it has always felt like the wrong workflow. The database client knows your data. It knows your schema. It has the connection. Why should analysis happen somewhere else?
That question has been driving the next big feature in Tabularis: Notebooks. A cell-based environment for SQL analysis, built directly into the app. No Jupyter kernel to configure, no Python runtime to install, no context switching.
This is still a work in progress — not shipped yet, not final. But the core is functional, the pieces are connecting, and I want to share where this is heading and why I think it matters.
Video unavailable
The Idea
A notebook is a sequence of cells. Each cell is either SQL or markdown.
SQL cells run against your database and show results inline — the same data grid you already know from the query editor, with sorting, filtering, and resizable result panels. Markdown cells let you document what you are doing, why, and what the results mean. Together they create a single, self-contained analysis document.
But cells are just the foundation. The interesting part is what connects them.
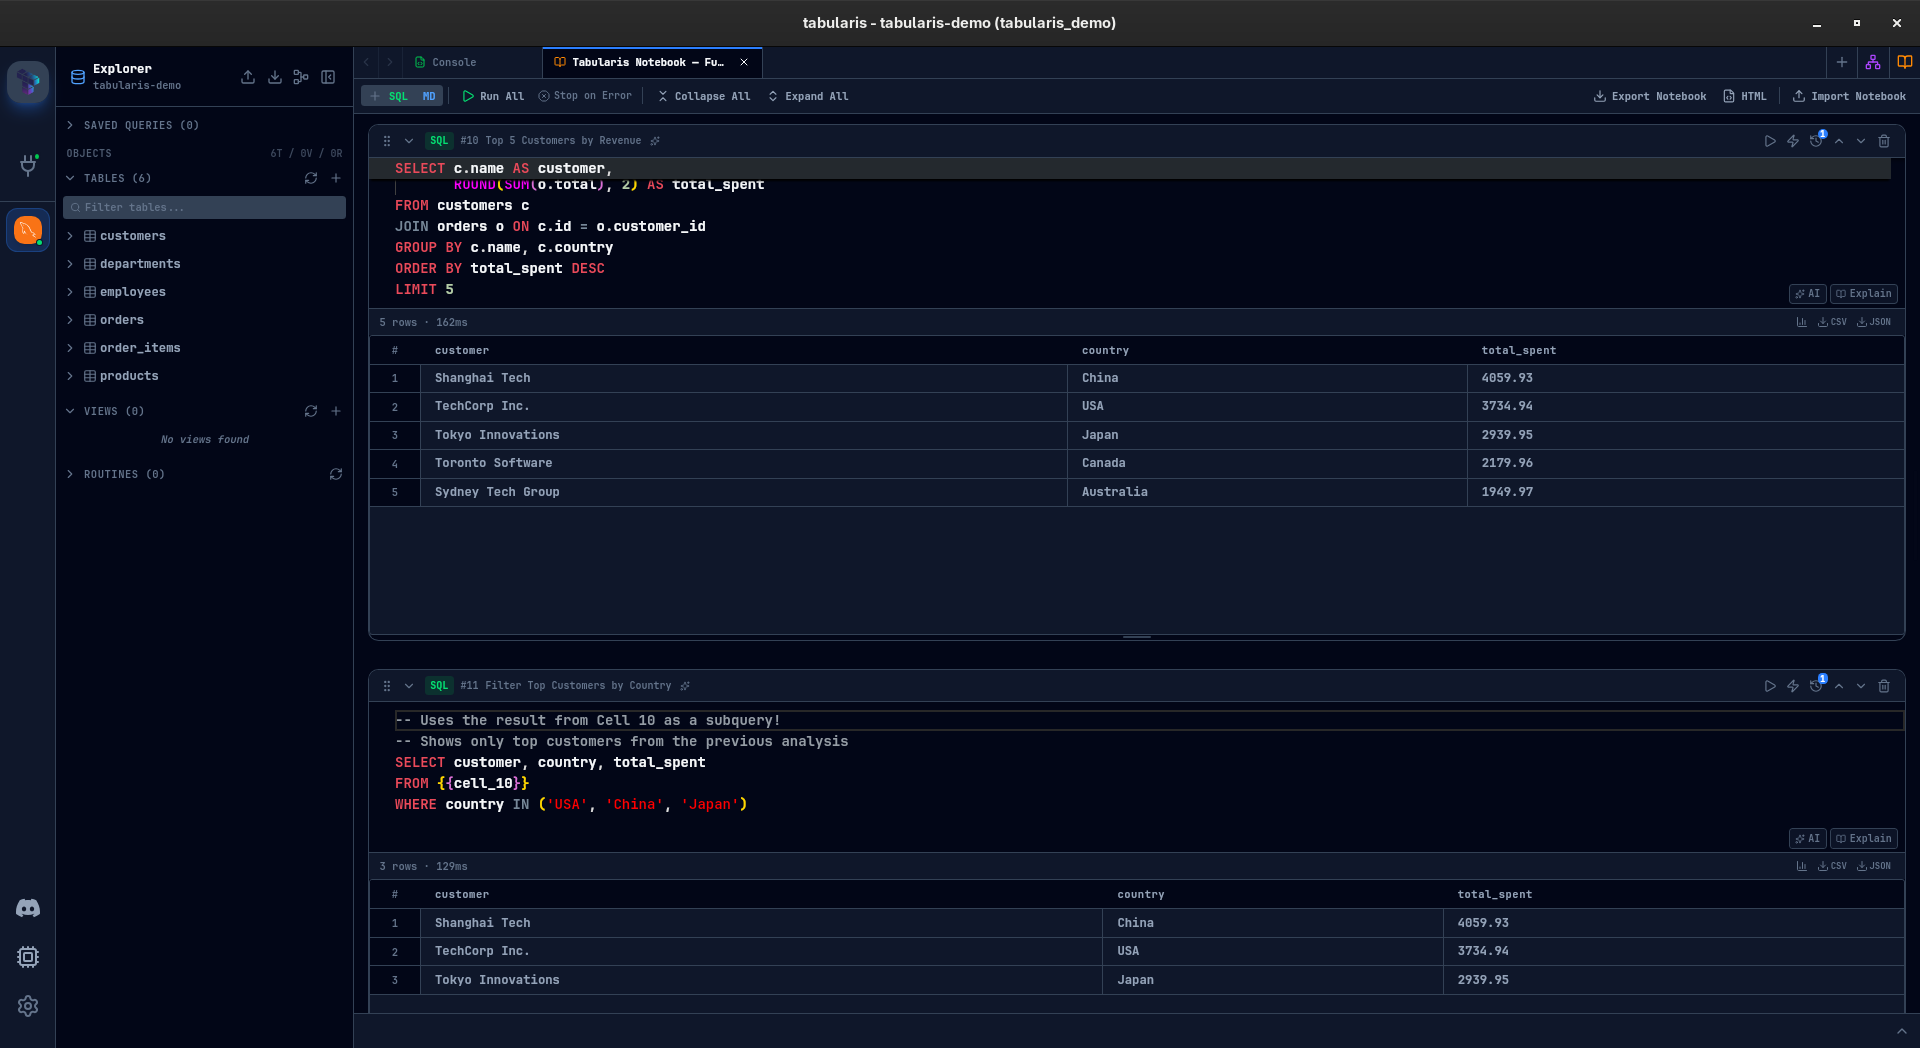
Cell References: Queries That Build on Queries
This is the feature I am most excited about.
Any SQL cell can reference a previous cell's query using {{cell_N}} syntax. Tabularis resolves this at execution time by wrapping the referenced query in a CTE:
-- Cell 1: Base query
SELECT customer_id, SUM(amount) AS total
FROM orders
GROUP BY customer_id

-- Cell 3: References Cell 1
SELECT * FROM {{cell_1}} WHERE total > 1000
When Cell 3 runs, Tabularis rewrites it to:
WITH cell_1 AS (
  SELECT customer_id, SUM(amount) AS total
  FROM orders
  GROUP BY customer_id
)
SELECT * FROM cell_1 WHERE total > 1000
No temp tables, no copy-paste, no drift. Change the base query, re-run the downstream cells, everything stays consistent. You can chain references across multiple cells to build complex analyses step by step, and each intermediate result remains visible and inspectable.
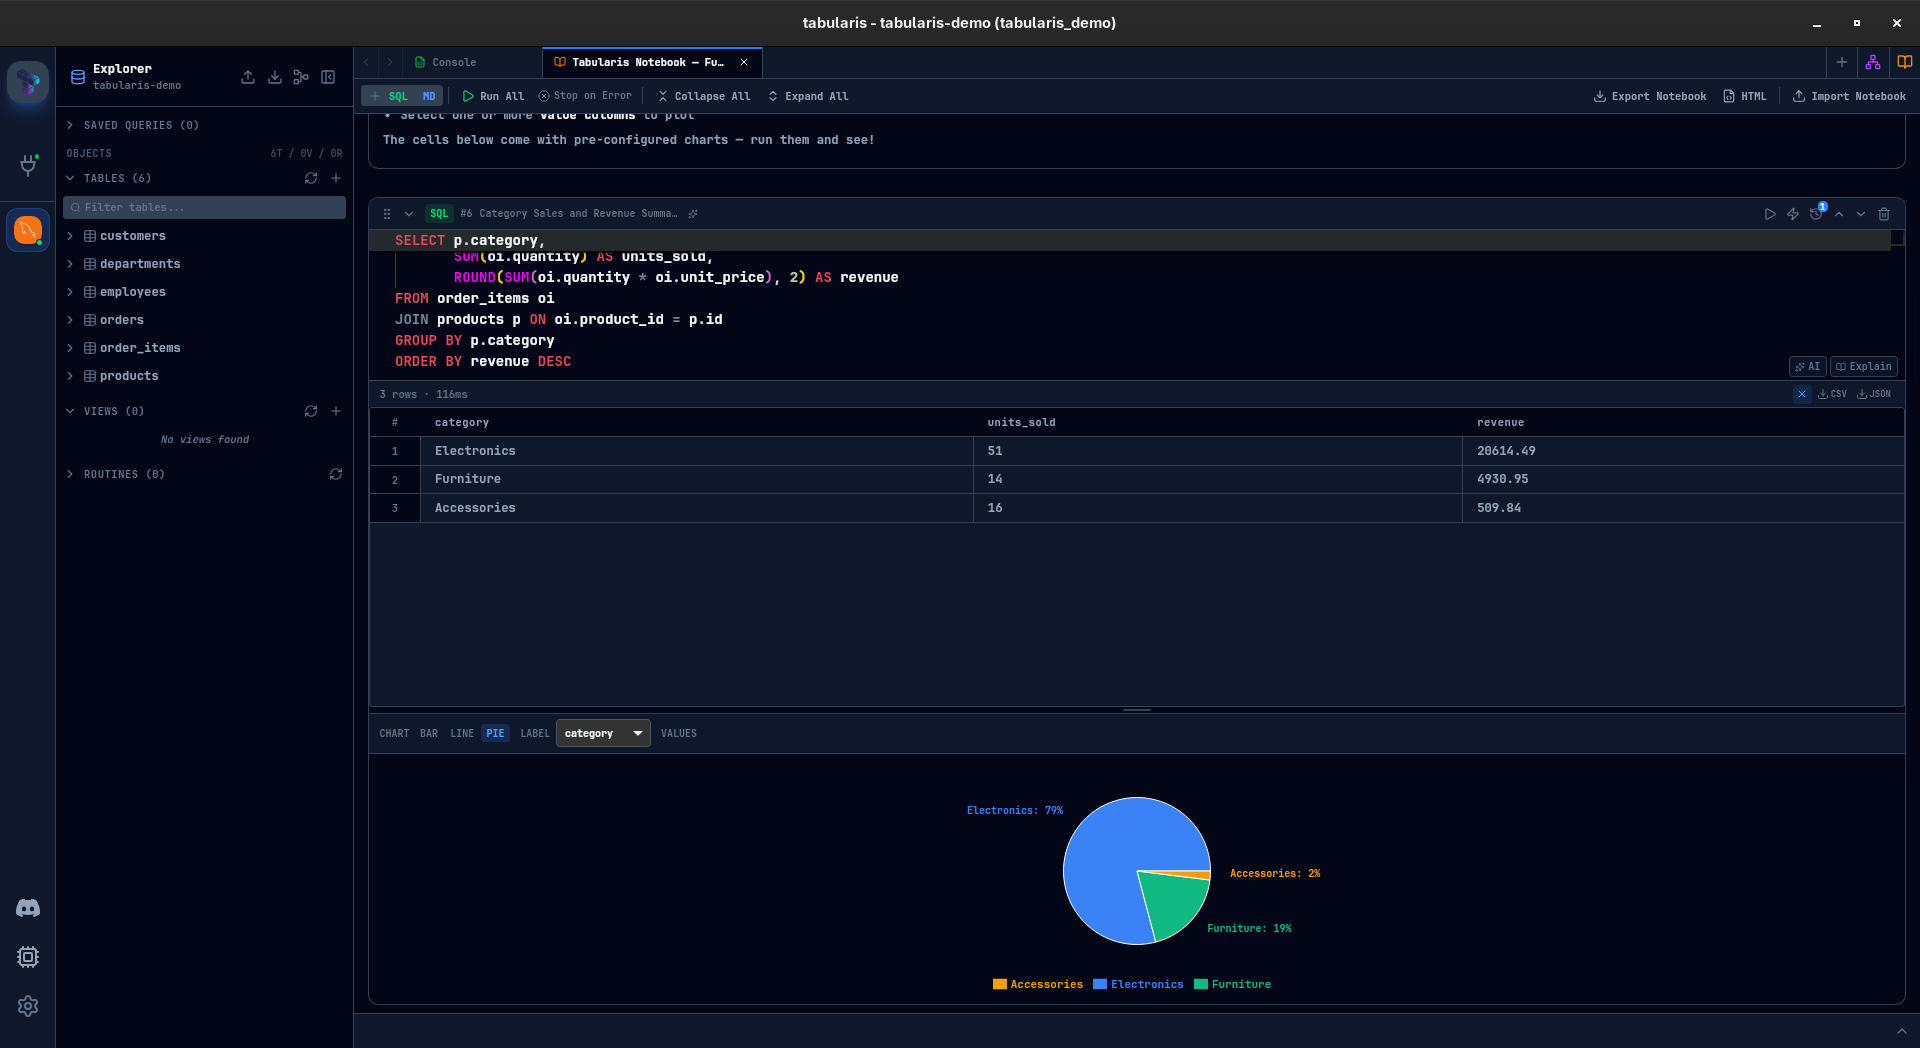
Inline Charts
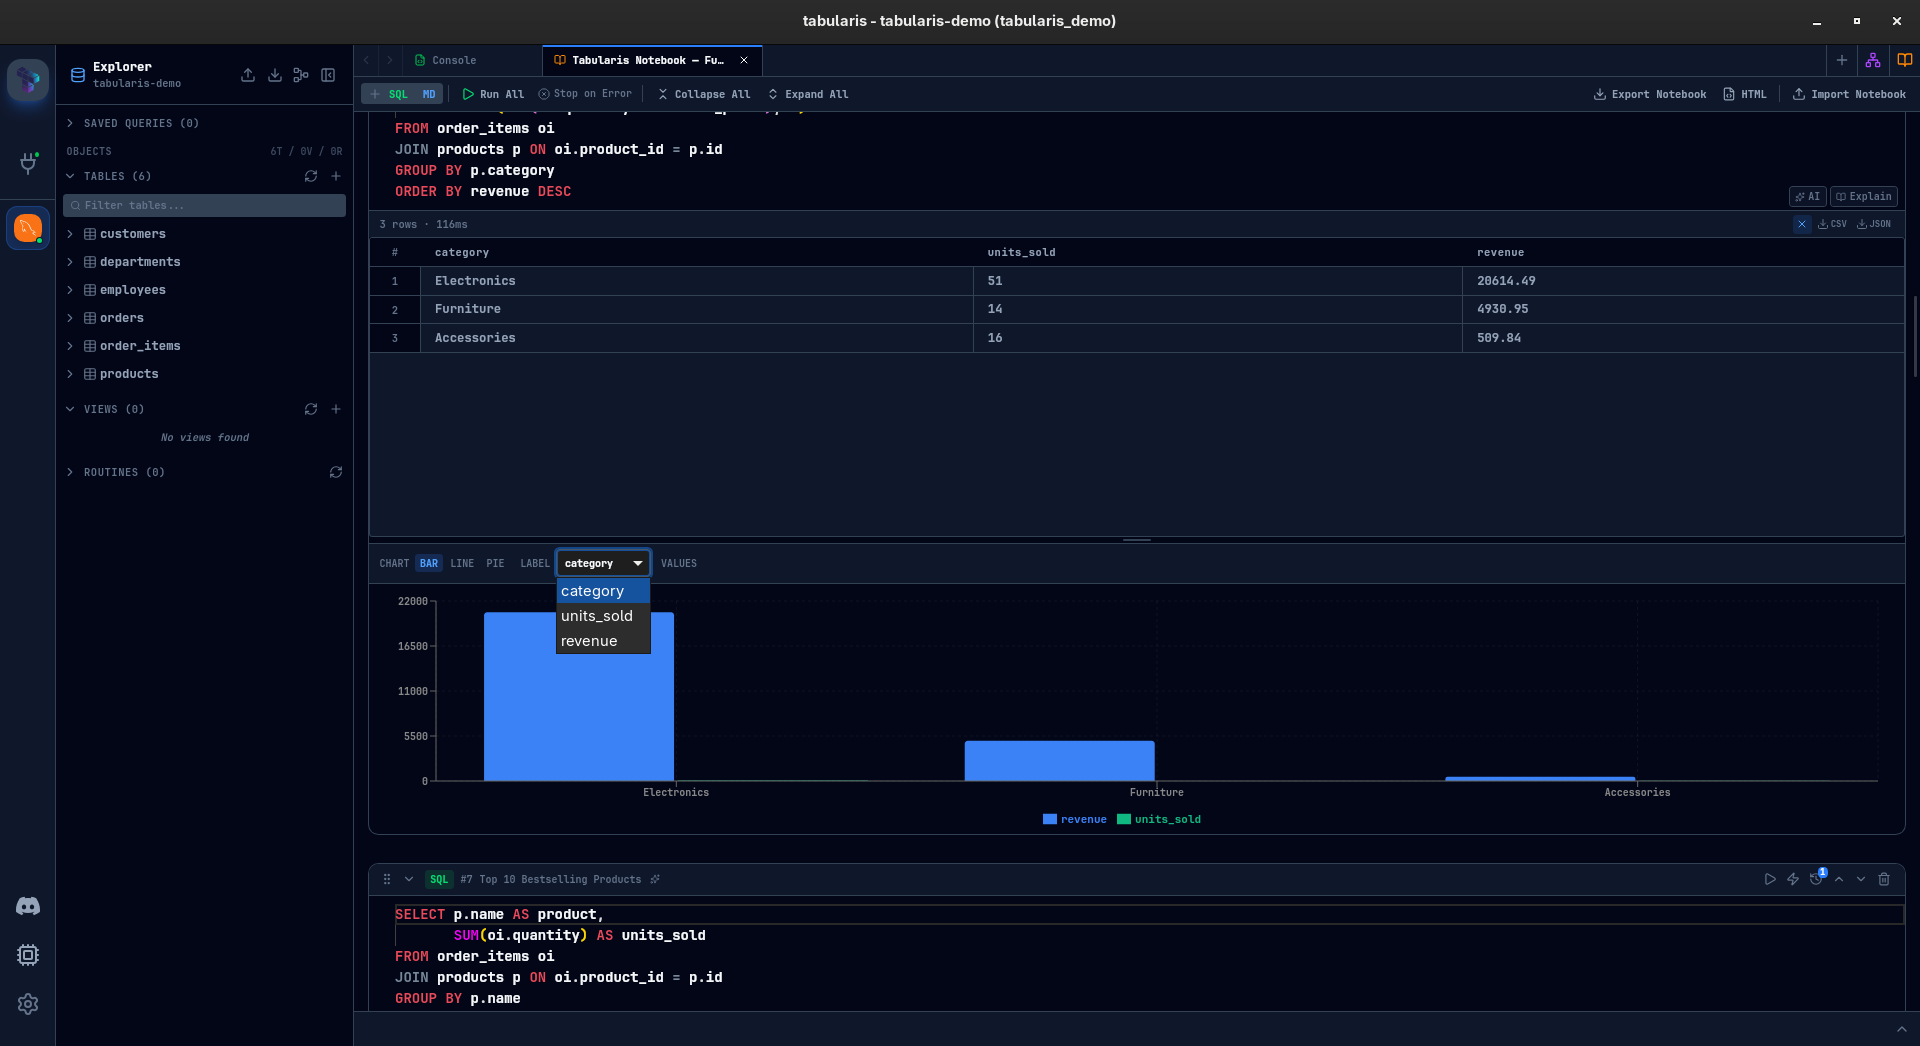
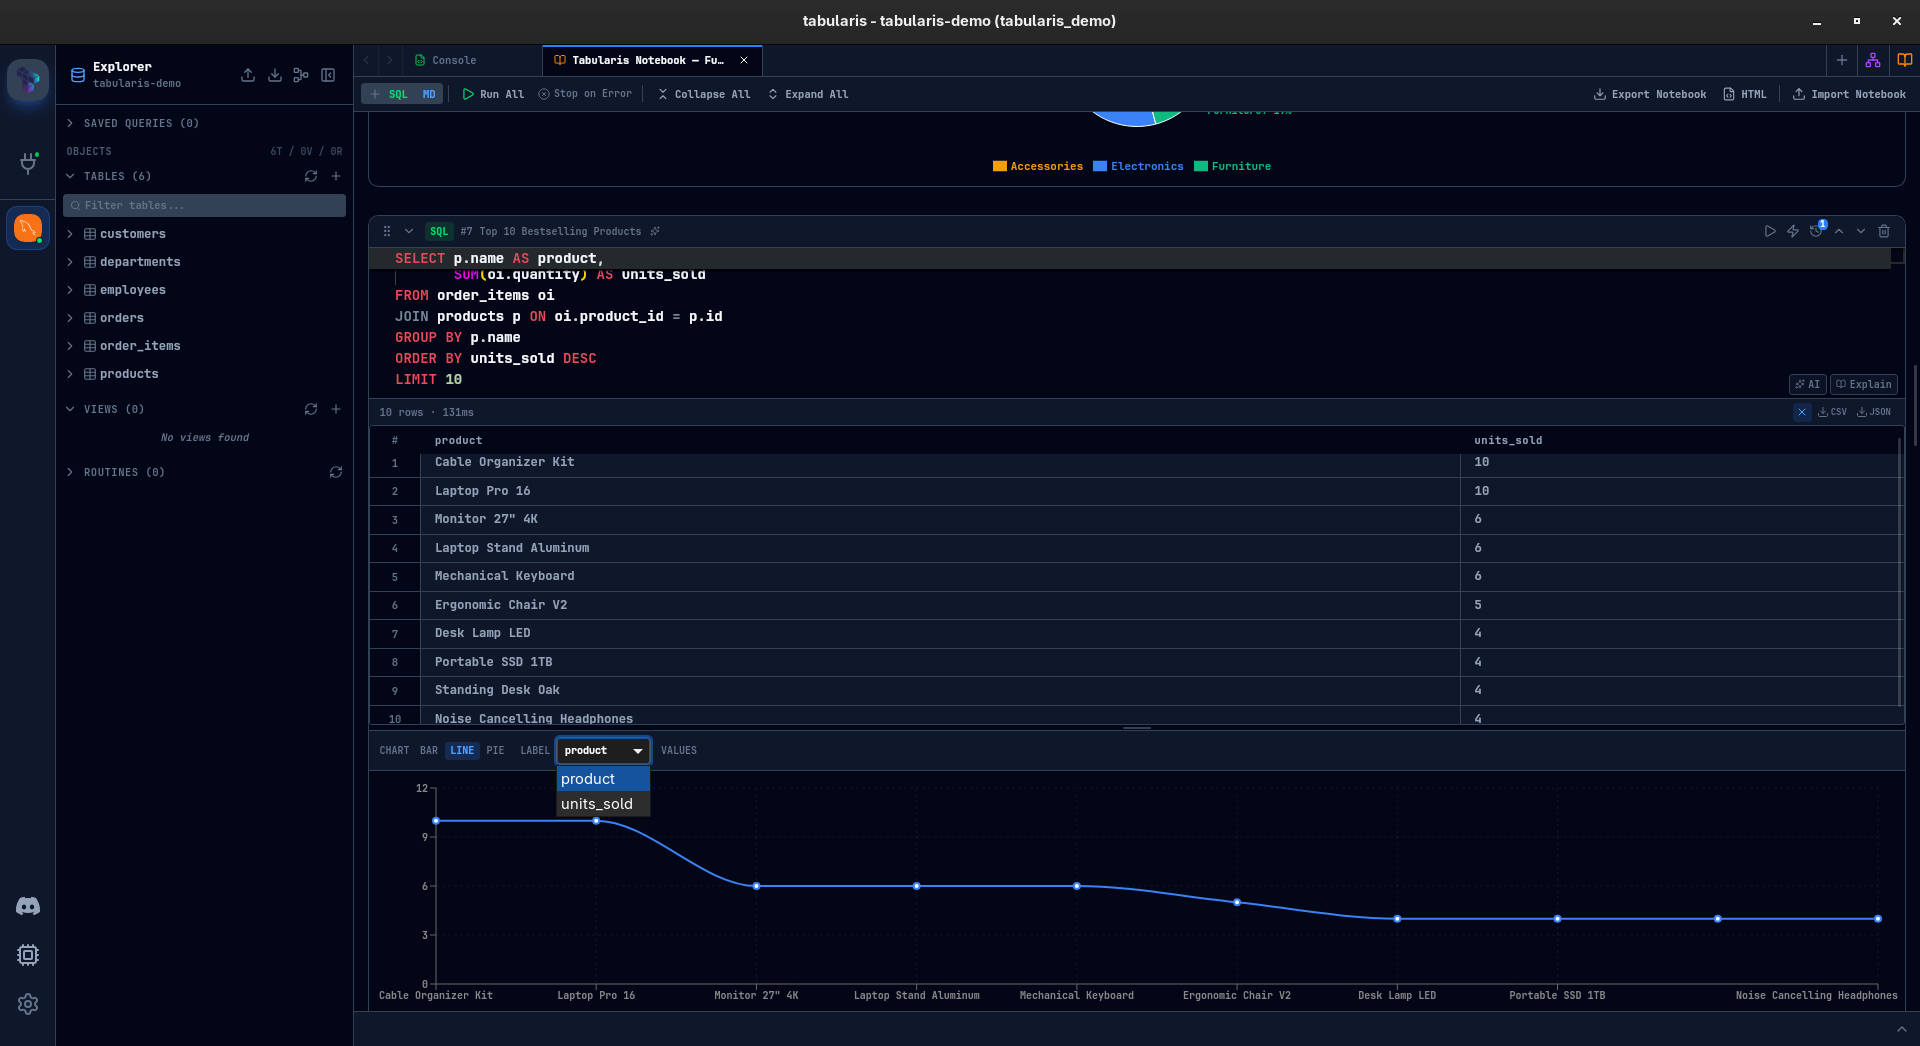
Every SQL result with at least two columns and one row can be visualized as a chart — directly inside the cell.
Three chart types so far: bar, line, and pie. You pick a label column and one or more value columns. Bar and line charts support multi-series. Pie charts take a single series. The chart configuration is saved with the cell — close the notebook, reopen it, the chart is still there.
This is not meant to compete with dedicated BI tools. It is for the moment when you are exploring data and want a quick visual confirmation of a pattern before writing the next query. That moment used to mean leaving the database client. Now it does not.
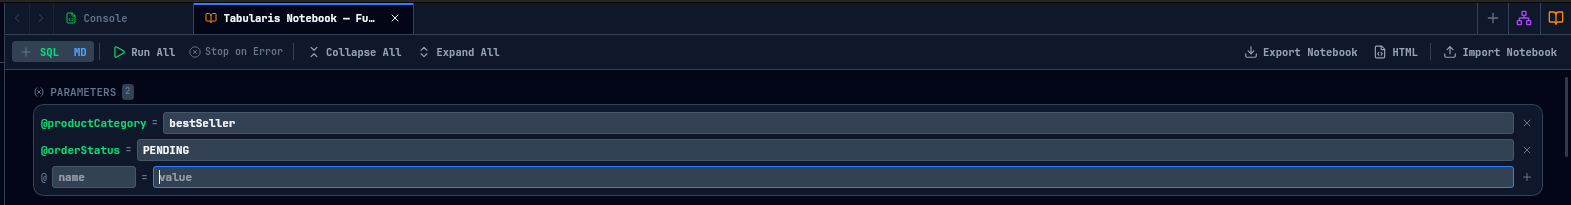
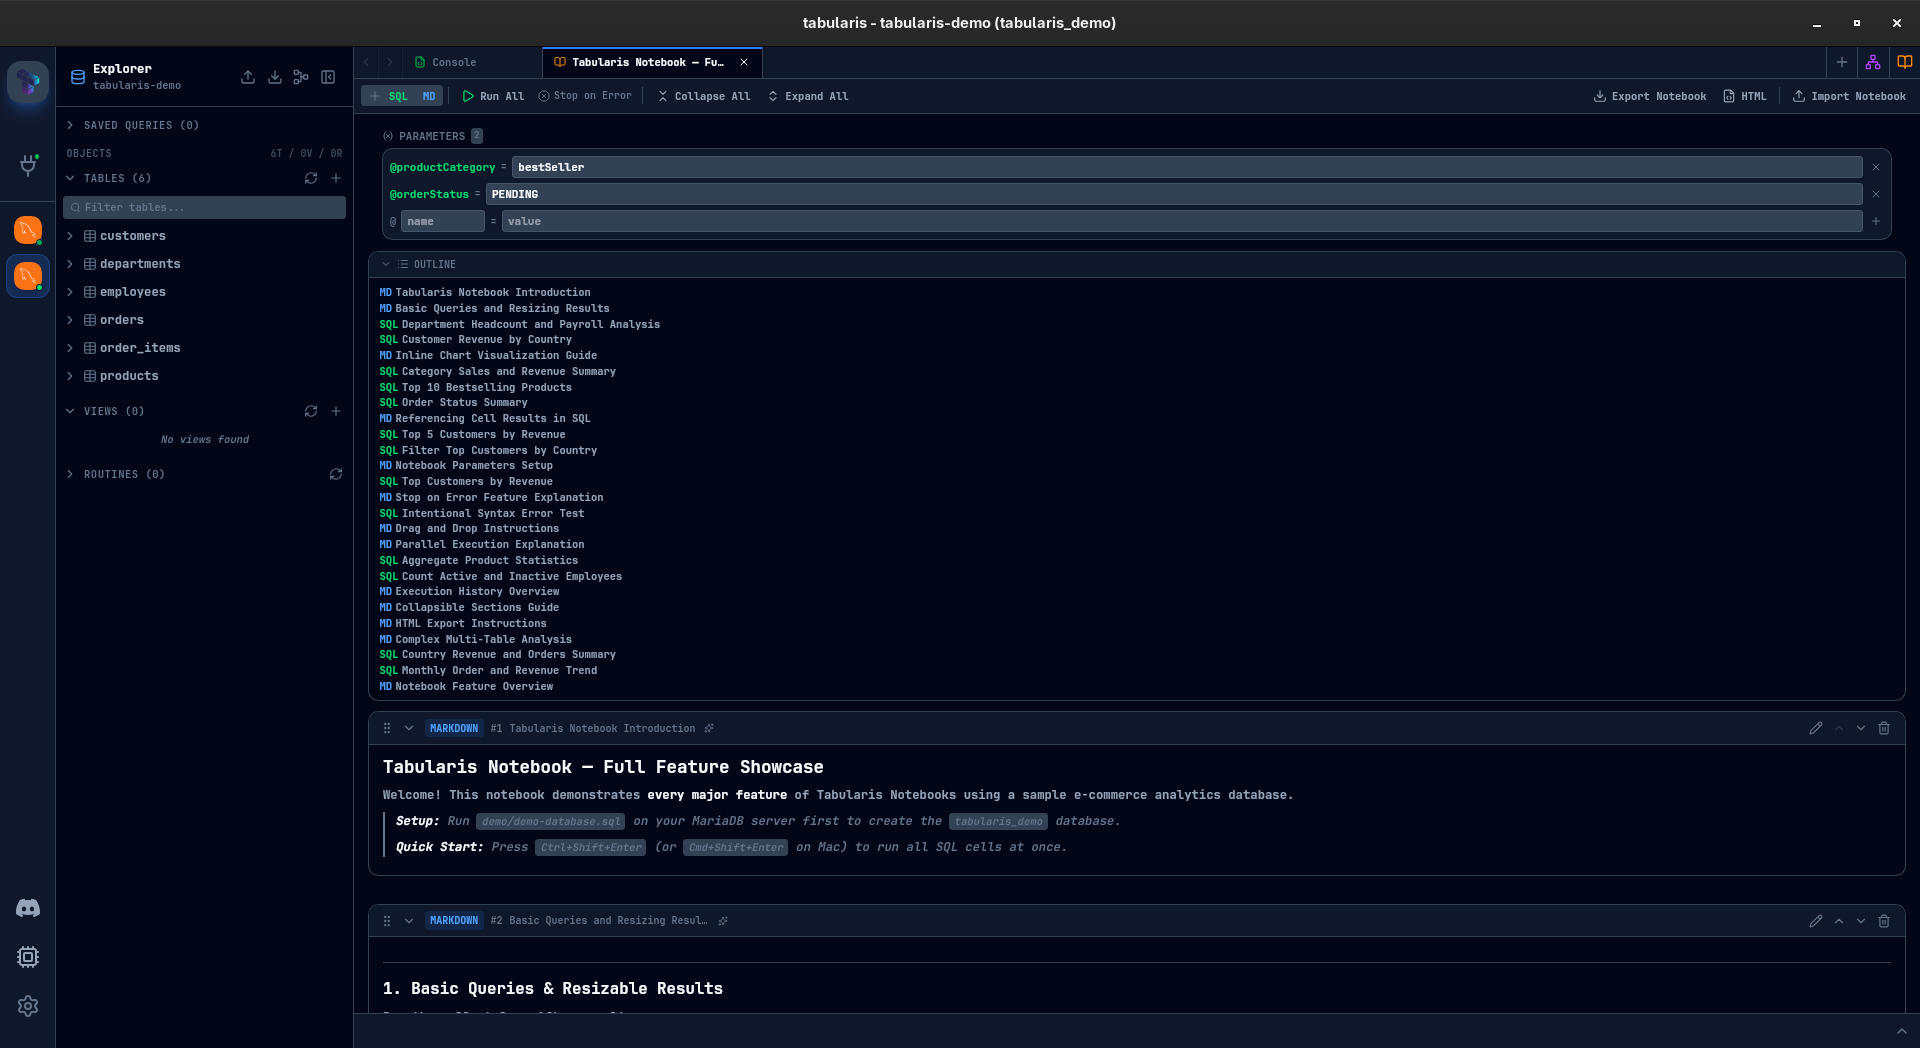
Parameters
Define a parameter once, use it across every cell:
@start_date = '2024-01-01'
@end_date   = '2024-12-31'
@min_amount = 500
Any SQL cell containing @start_date will have it substituted before execution. Change the value, re-run, every query picks up the new value.
Particularly useful for recurring analyses — monthly reports, cohort comparisons, threshold testing — where the logic stays the same but the inputs change.
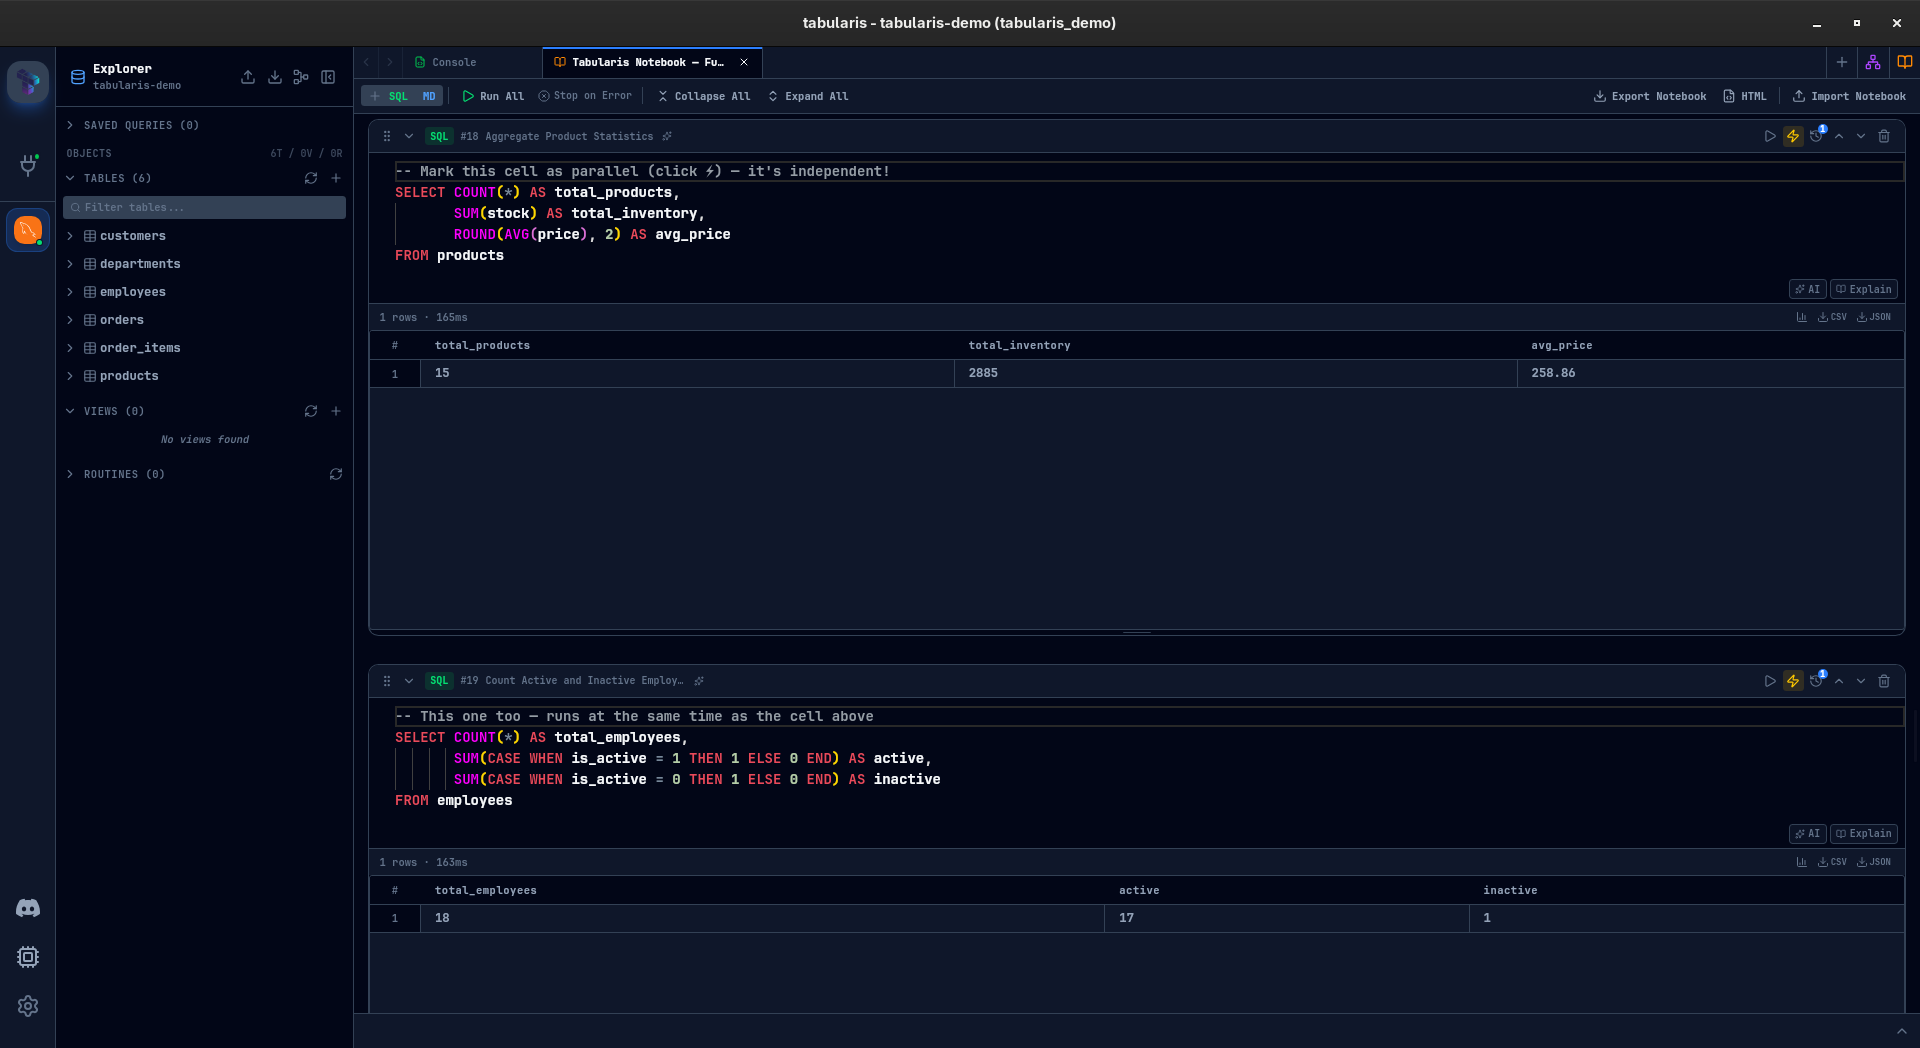
Parallel Execution
Not every cell in a notebook depends on the previous one. Some are independent queries — pulling data from different tables, running complementary aggregations that do not reference each other.
Mark a cell with the lightning bolt icon, and it runs concurrently during "Run All" instead of waiting for the cells above it to finish. For notebooks with heavy queries against different datasets, this can cut total execution time significantly.
Sequential cells still run in order. Parallel cells fire together. You control it per cell, one click.
Stop-on-Error and Run All
Hit Run All (or Ctrl+Shift+Enter) and every SQL cell executes top to bottom. The Stop on Error toggle controls whether execution halts at the first failure or powers through the rest of the notebook.
After execution, a summary card shows succeeded, failed, and skipped cells. Failed cells are clickable — tap one and the notebook scrolls straight to it. No hunting through a long document for the red cell.
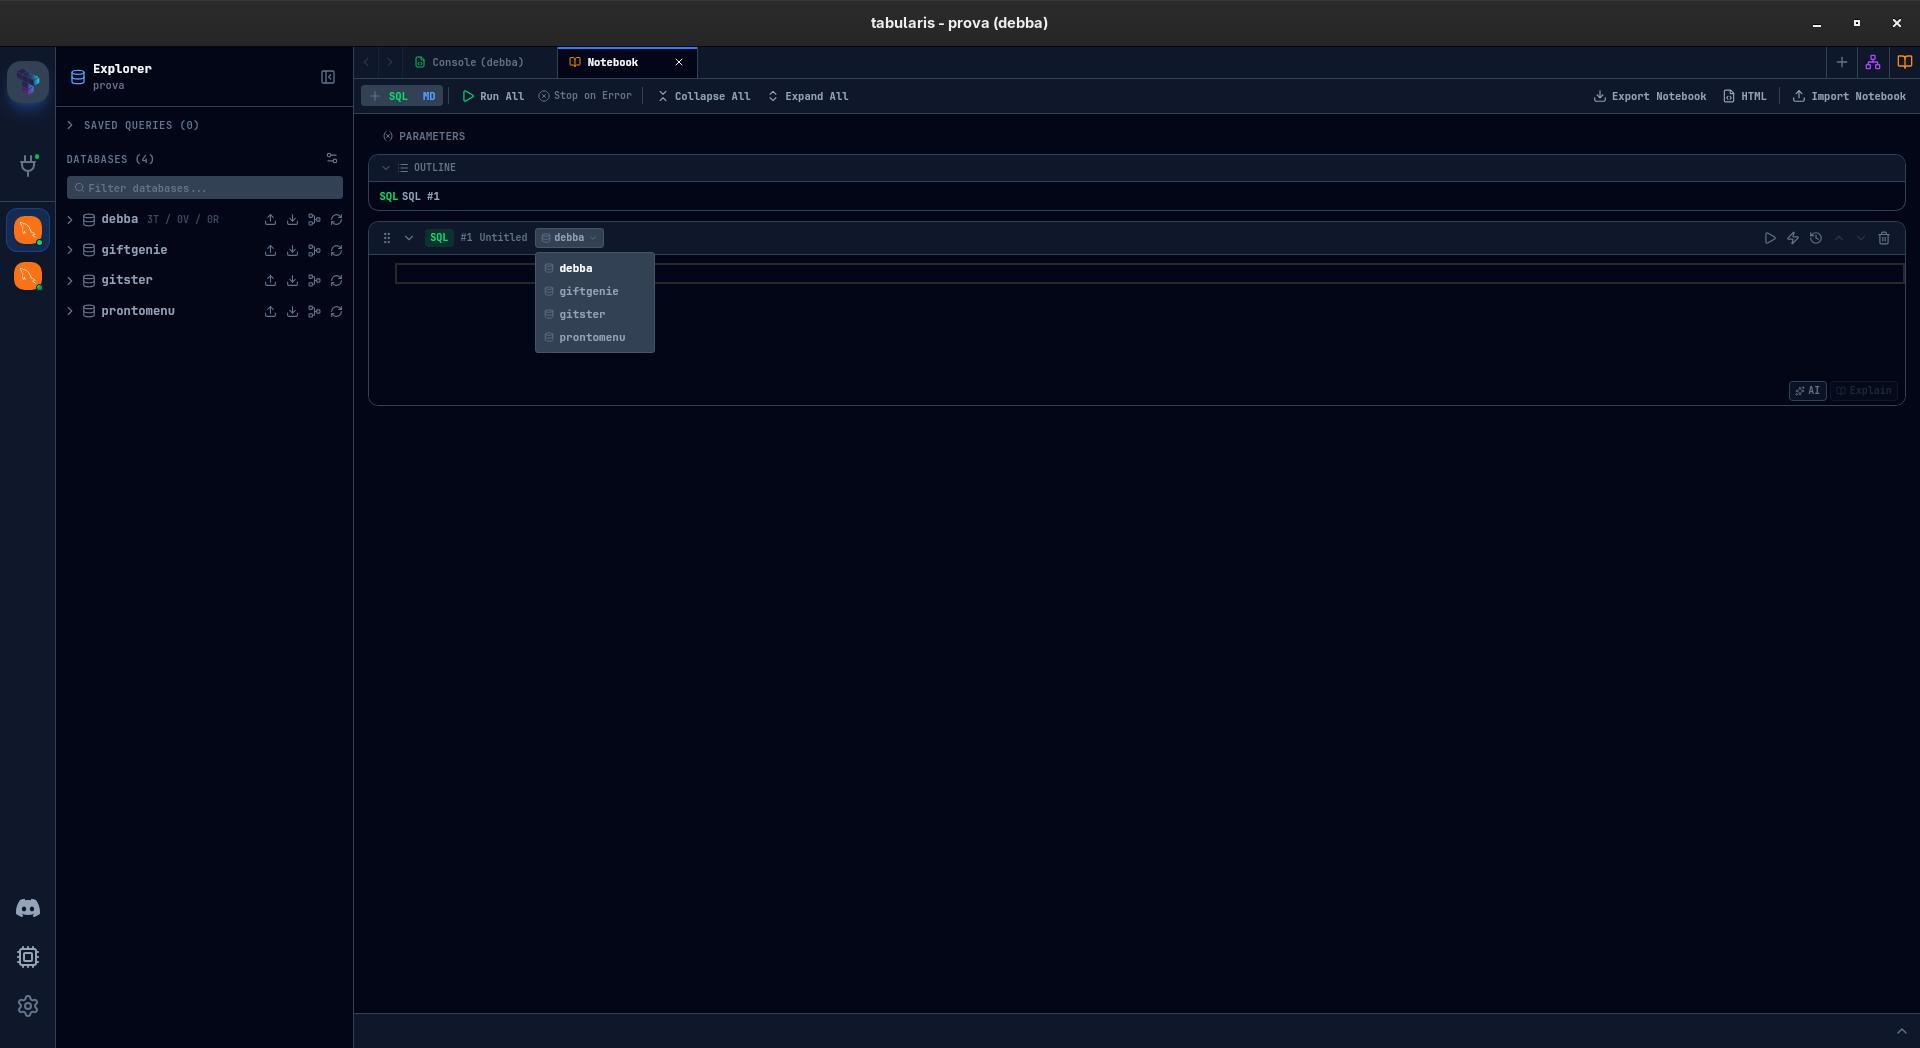
Multi-Database Queries
If you have multiple databases connected, each SQL cell can target a different one. A dropdown in the cell header lets you pick the schema — pull data from production PostgreSQL in one cell and compare it with your analytics SQLite in the next, all within the same notebook.
Works across MySQL, MariaDB, PostgreSQL, and SQLite.
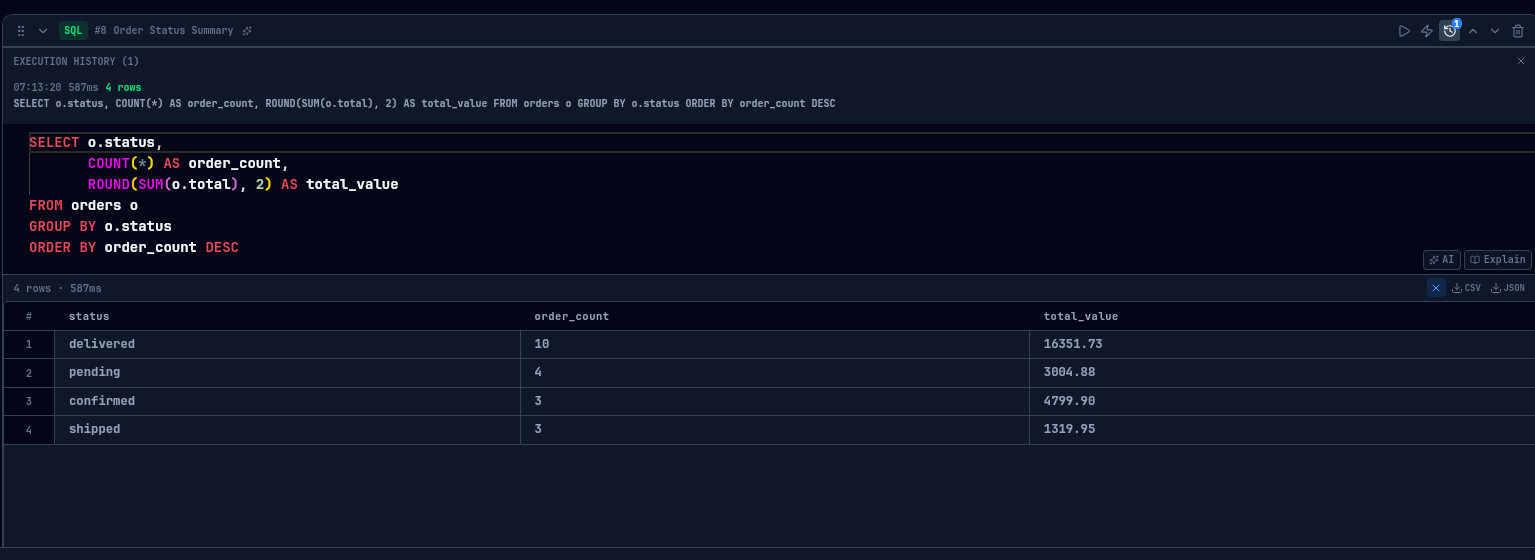
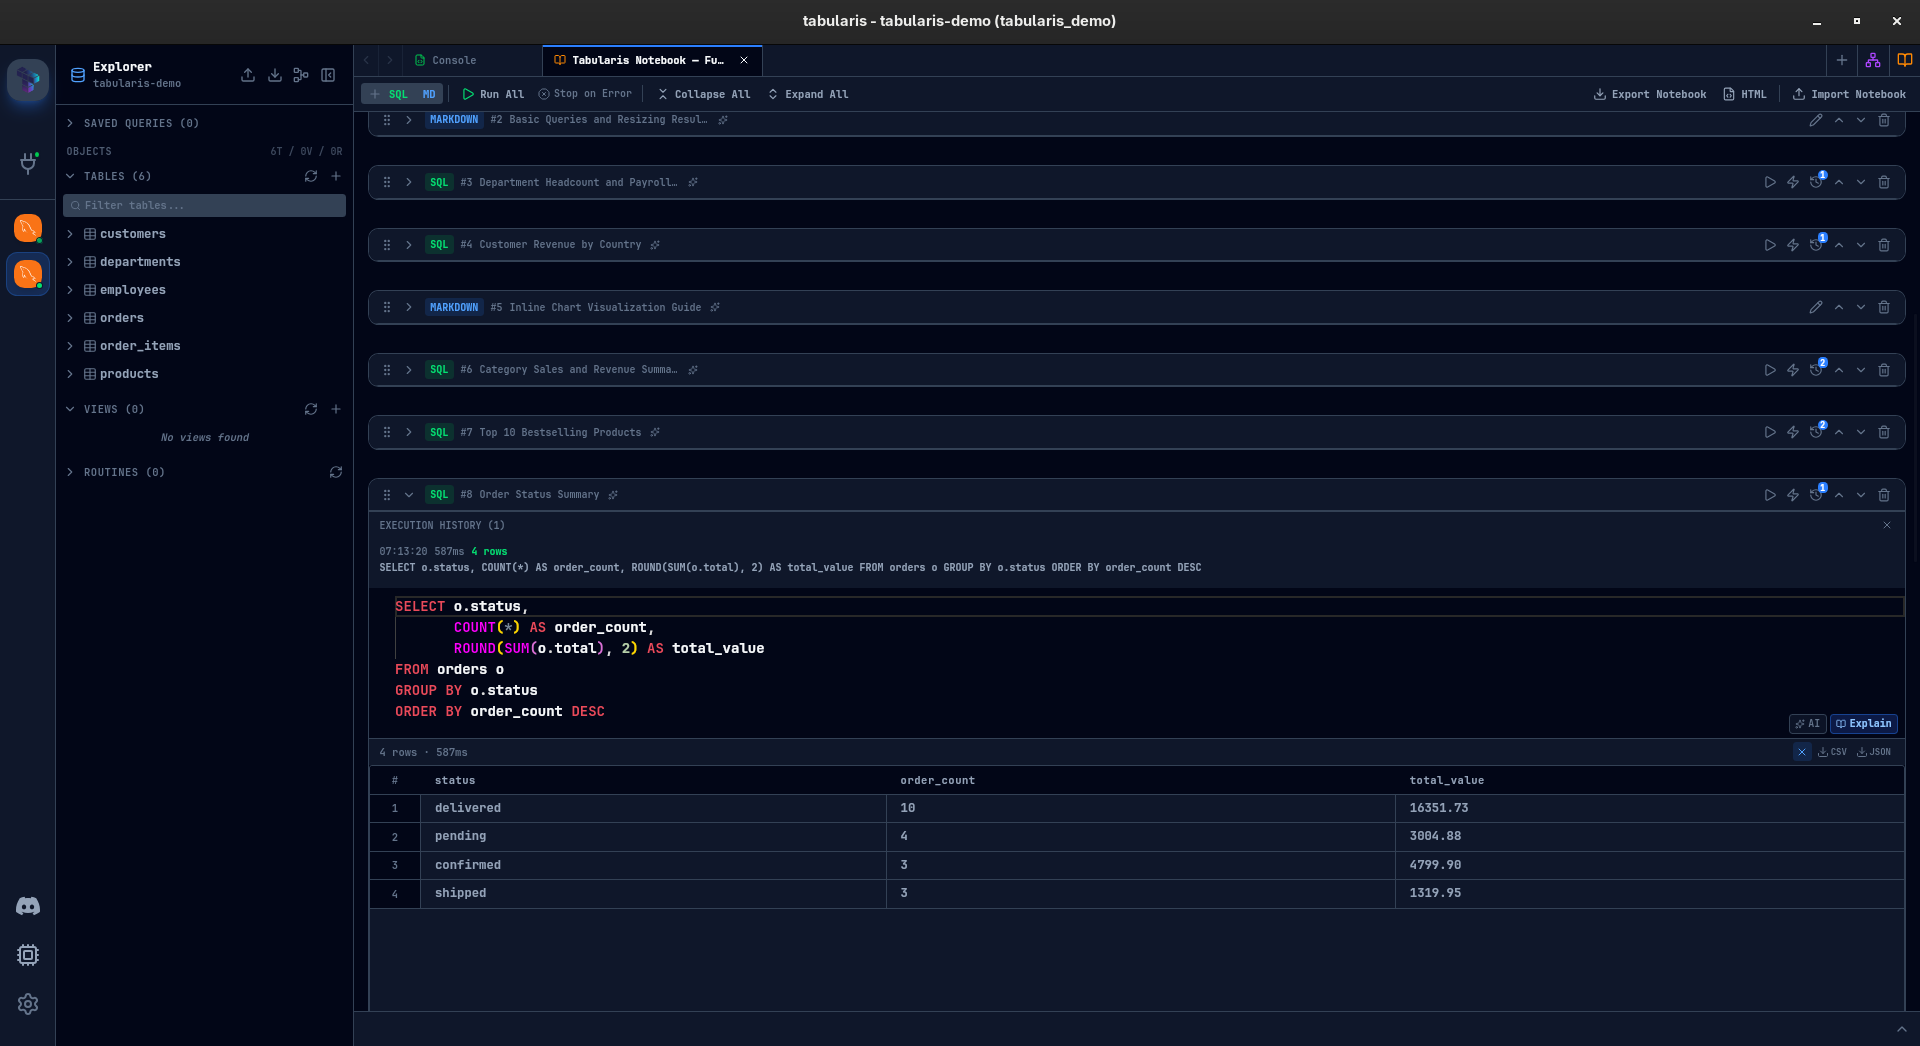
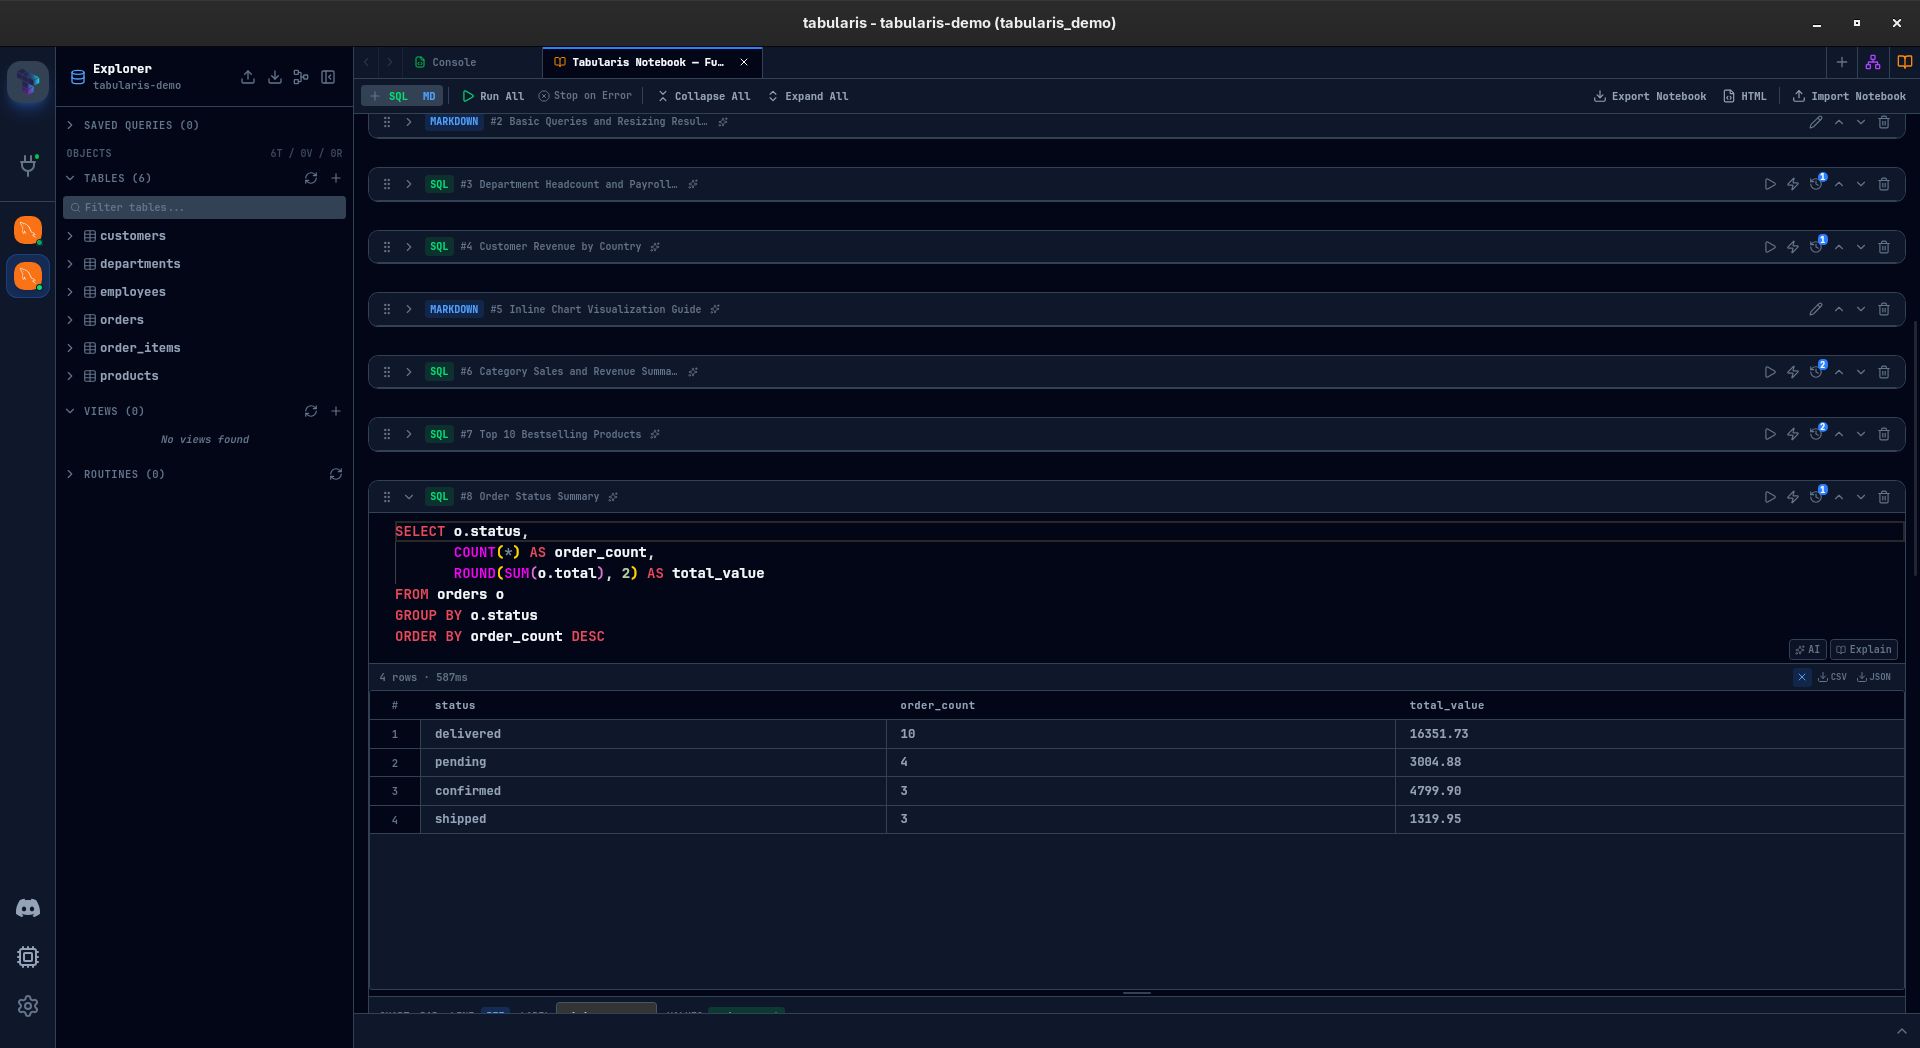
Execution History
Every SQL cell keeps a record of its last 10 executions — timestamp, execution time, row count. Expand the history panel, pick any previous run, and restore that query version. Useful when you have been iterating on a cell and want to go back, or when you need to compare current results against an earlier run.
AI Integration
Notebooks plug into the AI features that already exist in Tabularis, in two ways.
In the editor: each SQL cell has "AI" and "Explain" buttons. "AI" opens the generation modal — describe what you want, get SQL back. "Explain" takes the current query and breaks it down. Same tools available in the main query editor, now available per cell.
Cell naming: click the sparkles icon in any cell header, and AI generates a descriptive name based on the cell content. Named cells appear in the notebook outline — a collapsible panel that shows all cell names and markdown headings as a table of contents. For long notebooks, this turns a wall of anonymous cells into a navigable document.
Finding Tabularis useful? Star it on GitHub — it takes a second and helps more developers discover the project. Star on GitHub
Organization
Notebooks can grow. To keep them manageable:
- Collapse any cell to hide its body and results, showing just the header.
- Drag and drop cells to reorder them.
- Cell names (manual or AI-generated) give each cell identity beyond "Cell 7."
- Markdown cells act as section headers and documentation between query groups.
Import and Export
Two export formats are taking shape:
.tabularis-notebook — a JSON file containing the notebook structure: cells, parameters, chart configurations, cell names. No results or runtime data — it is a template. Share it with a colleague, they import it, connect to their database, and run it.
HTML export — a self-contained HTML document with rendered markdown, SQL highlighting, and result tables embedded. Dark-themed, ready to share or archive. The "send it to your manager" format.
Individual cell results can also be exported as CSV or JSON from the result toolbar.
What Is Still Cooking
This is an honest preview. Some things work, some things need polish, some things might change before release. A few areas I am still iterating on:
- Performance with large notebooks — 30+ cells with heavy results need more work on virtualization and memory management.
- Cell reference validation — right now circular references are not caught before execution. That needs a proper dependency graph.
- Chart customization — axis labels, color palettes, and data formatting are minimal. Enough to explore, not enough to present.
- Keyboard navigation — moving between cells, adding cells, running cells — all of this should be possible without touching the mouse. Partially there, not fully.
- Undo/redo at the notebook level — cell-level undo works (it is Monaco), but notebook-level operations like reorder and delete are not undoable yet.
I would rather ship this with rough edges acknowledged than wait for perfection. The core value — connected, documented, visual SQL analysis inside the database client — is already there. The rest is refinement.
Why This Matters
Database clients have been stuck in a loop: connect, query, look at a table, repeat. Analysis tooling evolved — Jupyter, Observable, dbt — but the database client stayed behind. You still need to leave it the moment your work goes beyond a single query.
Notebooks in Tabularis are a bet that the database client is the right place for exploratory SQL analysis. You already have the connection. You already have the schema. You already have autocomplete and query history. Adding cells, charts, references, and parameters on top of that foundation means the entire workflow — from first query to shareable report — can happen without switching tools.
This is not a Jupyter replacement. There is no Python, no R, no arbitrary code execution. It is purpose-built for SQL. And for the kind of work most people actually do with their database every day — ad-hoc exploration, report building, data validation, performance investigation — that focus is a feature, not a limitation.
Stay tuned. This is landing soon.