AI Safety, Audit Log and Approval Gates: v0.10.0

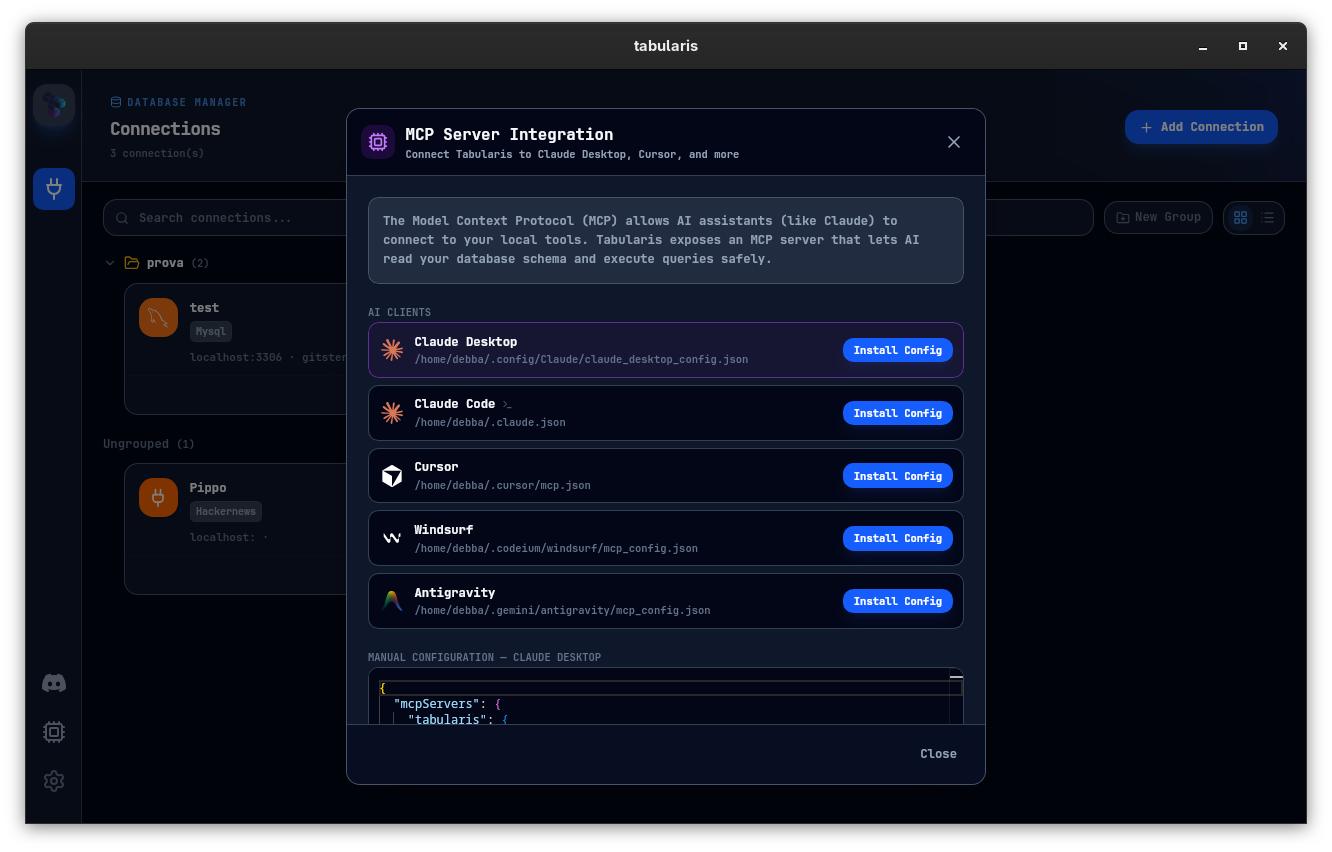
Tabularis has been MCP-native since v0.9.9: Claude Desktop, Claude Code, Cursor, Windsurf and Antigravity can all talk to your saved connections through the tabularis --mcp server, with schema reading, table description and query execution. The catch up to now is that once you set MCP up, the agent had the same level of access you do.
v0.10.0 is the release that closes that gap. Three features land together, all visible at the first launch after the upgrade:
- An audit log of every MCP tool call, stored locally and queryable from a new Settings panel.
- Read-only mode to block writes per-connection or globally.
- Approval gates that pause writes and require user confirmation, with a pre-flight EXPLAIN plan rendered inside the modal.
Two smaller features come along for the ride: exporting an entire AI session as a SQL notebook, and jumping from any audit row into Visual Explain.
1. The audit log
Every MCP tool call is now recorded as one line of JSON in ~/.config/tabularis/ai_activity.jsonl:
{"id":"4f9b…","sessionId":"a8c1…","timestamp":"2026-04-24T14:02:11Z",
 "tool":"run_query","connectionId":"prod-pg","connectionName":"prod",
 "query":"SELECT count(*) FROM orders","queryKind":"select",
 "durationMs":42,"status":"success","rows":1,
 "clientHint":"claude-desktop","approvalId":null}
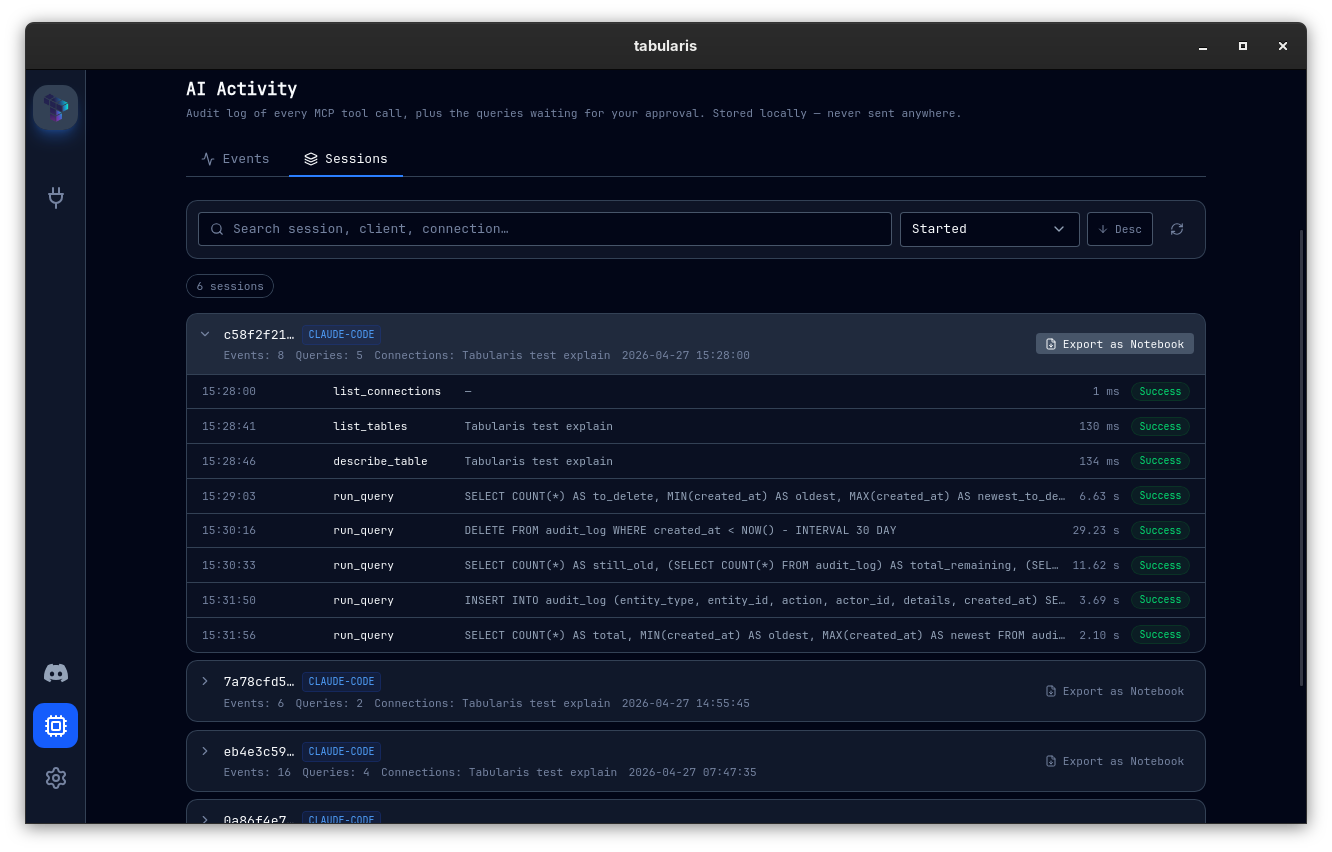
A new MCP → Activity tab in the app reads this file (the plug icon in the sidebar opens the MCP page). It has two sub-tabs:
- Events: flat, filterable, exportable to CSV or JSON.
- Sessions: events auto-grouped by 10-minute inactivity gaps, with a per-session Export as Notebook button.
The Sessions sub-tab is probably the most useful of the two. One click and you get a valid .tabularis-notebook file you can replay or attach to a PR:
- A markdown header with session metadata (client, connections, time range, event count).
- One SQL cell per
run_query, in chronological order. - Cell names taken from the first
--comment in the query when present. - Markdown context cells for the
list_tablesanddescribe_tablecalls so the agent's investigation trail stays intact.
Results aren't embedded; opening the notebook re-executes the cells, same as every other Tabularis notebook.
If you want to disable the audit log entirely, setting aiAuditEnabled: false in config.json falls back to the original code path with zero overhead.
2. Read-only mode
The simplest of the three features, configured under MCP → Safety → Read-only mode:
- Allow-list of read-only connections (default off, e.g. mark
prodas read-only). - Allow-list of writable connections (default on, e.g. mark
local-sqliteas writable).
The classifier strips strings, comments and quoted identifiers before scanning the SQL keyword, and catches CTEs that end in UPDATE / INSERT / DELETE. Anything ambiguous is treated as a write: fail-closed is the safer default when the alternative is a corrupted production table.
Blocked calls land in the audit log with status = blocked_readonly and the agent gets:
Query blocked by Tabularis read-only mode. Enable writes for this connection in Settings → MCP → Read-only mode.
Most agents handle this gracefully — they rewrite as a SELECT or surface the error to you.
3. Approval gates with pre-flight EXPLAIN
Approval gates are the most involved of the three features, and the part that makes giving an agent write access to a real database feel like a sane choice.
When the agent fires a write, Tabularis pauses it and shows an AI Approval Modal:
- The full SQL in a Monaco editor (read-only by default; toggle "Edit before approving" to modify it).
- The execution plan, rendered with the same Visual Explain component used for ad-hoc EXPLAINs.
- An optional reason field. Approve, Deny, or close the modal.
The point is that you can see, before any row is touched, that the UPDATE would do a sequential scan over 1.2 million rows. You can fix the WHERE clause, add the right index hint, then approve. The audit log captures both the original and the edited query, linked by an approvalId.
There are three modes: off, writes_only (the default) and all queries. The timeout is configurable (120 s by default). Pre-flight EXPLAIN is best-effort: if it fails (DDL, syntax errors, missing permissions) the modal still opens with an "EXPLAIN unavailable" notice and you can decide anyway.
How approval gates actually work
The MCP server runs as a separate subprocess. The AI client spawns tabularis --mcp as a child process and the two talk over JSON-RPC 2.0 on stdin/stdout. That subprocess has no Tauri runtime, no AppHandle, and no socket back to the main app.
Asking the user to approve a write across that boundary needs some kind of channel. Three options were on the table:
- A real RPC channel between the MCP subprocess and the main Tabularis app. Workable, but it means teaching the MCP binary to discover the running app, open a Unix socket or named pipe, handle disconnect and reconnect, deal with ports on Windows, and so on. A lot of moving parts for something fragile.
- Desktop notifications from the OS. Quick to implement, but a desktop notification can't render a Visual Explain plan, which would defeat half the point of the feature.
- A file queue. Both processes touch the same directory: the MCP server writes a request file and polls for a response file, while the Tabularis app uses
notify(the inotify/FSEvents/ReadDirectoryChangesW crate) to watch the directory and pops up the modal as soon as a file appears.
Option 3 turned out to be the best fit. The directory looks like this:
~/.config/tabularis/pending_approvals/
  ├── {uuid}.pending.json    ← MCP server writes
  └── {uuid}.decision.json   ← Tabularis app writes
pending.json carries the full payload: query, classifier kind, connection, EXPLAIN plan as JSON, and the agent's clientInfo.name. decision.json carries the verdict (approve or deny), an optional reason, and an optional editedQuery if the user touched the SQL before approving.
The MCP server polls every 500 ms. The Tabularis app's file watcher fires the modal almost instantly. A periodic janitor (every 60 s) wipes anything older than an hour, so the directory never grows.
The whole thing is roughly 200 lines of Rust, with no IPC framework involved. It also works if you launch the agent before opening Tabularis: the request queues in the directory and the modal handles it the moment the app comes up. If Tabularis stays closed for the entire timeout (120 s by default), the call returns a clear error to the agent telling it to start the app first.
A nice side effect of the file queue is that the flow is testable end-to-end without an MCP client. Drop a pending.json with a fake payload into the directory, watch the modal pop up, click Approve, and a decision.json appears. No mocking required.
Bonuses
Open in Visual Explain. Every run_query row in the AI Activity panel has a one-click jump into the same Visual Explain modal that the query editor uses. It opens with the query and connection pre-loaded, runs EXPLAIN, and shows you the plan. Handy when a slow query shows up in the log and you want to know why.
Export Session as Notebook. Already covered above, but worth repeating: this is how an otherwise opaque AI conversation turns into something a human can review, diff and re-run. Attach the notebook to a PR, share it with a colleague, archive it alongside the ticket.
Finding Tabularis useful? Star it on GitHub — it takes a second and helps more developers discover the project. Star on GitHub
Defaults
After this upgrade:
| Setting | Default |
|---|---|
aiAuditEnabled |
true |
aiAuditMaxEntries |
5000 |
aiSessionGapMinutes |
10 |
mcpReadonlyDefault |
false |
mcpReadonlyConnections |
[] |
mcpApprovalMode |
writes_only |
mcpApprovalTimeoutSeconds |
120 |
mcpPreflightExplain |
true |
Audit on, approval on writes_only, pre-flight EXPLAIN on. The first time the agent tries to write after upgrading, the modal will pop up. SELECTs go through without any friction.
To keep the previous behaviour wholesale, set aiAuditEnabled = false and mcpApprovalMode = "off" in config.json (or do the same from the MCP page in the app).
Where to read more
- Wiki: AI Audit Log · Read-only Mode · Approval Gates · MCP Server
None of this changes anything from the agent's point of view; it sees the same MCP server with the same tools. What changes is on the human side. The MCP page in the app (plug icon in the sidebar) is now organised into three tabs (Setup, Activity, Safety), and a modal will show up the next time the agent reaches for the database with anything sharper than a SELECT.
Summary
| Area | What's new |
|---|---|
| AI Activity | New MCP → Activity tab with Events + Sessions sub-tabs |
| AI Activity | Local JSONL audit log of every MCP tool call (5,000-entry rotation × 5 archives) |
| AI Activity | One-click "Export as Notebook" per session |
| AI Activity | "Open in Visual Explain" on every run_query row |
| MCP | Read-only mode — global default + per-connection override list |
| MCP | Approval gates — three modes (off / writes_only / all) |
| MCP | Pre-flight EXPLAIN inside the approval modal |
| MCP | Edit-before-approving — modify the SQL before it executes |
| Architecture | File-queue IPC between the MCP subprocess and the Tabularis app — no socket needed |
Thanks
A safety release is the kind of work that lives or dies on the questions people ask before merging, and on the bug reports that come back the same day a build ships. Thanks to everyone who tested the modal flows, pointed at edge cases in the read-only classifier, and helped shape what writes_only should actually mean in practice.


v0.10.0 is available now. Update via the in-app updater, or download from the releases page.