


Visual EXPLAIN is the Tabularis feature people screenshot. You run a query and it turns the database's EXPLAIN output into a graph, a diagram, a table and a statistics view. It also reports findings for individual nodes, which is usually where the useful work begins: finding the bottleneck in a large plan.
For a few months I had wanted the same views on the web. There are already websites that let you inspect an EXPLAIN plan online, but none of them worked quite the way I wanted. I wanted to copy the output from psql or the MySQL shell, paste it into a page and inspect the plan without installing anything. I also did not want the site to store anything people pasted. I see little practical value in collecting queries for what should be a temporary analysis session. For a persistent workflow, there is the Tabularis desktop app. Since parsing a plan does not need a server, the page could be static and keep all the data in the browser.
Claude Opus 5 had just been released, and I wanted to give it a real task in this codebase. This was a useful test for an agent because I could state the architectural rule in one sentence and verify the mechanical work with 3,286 tests. The judgement calls were still mine. This was the rule:
A plan visualiser needs a plan, not a database.
The rest of the work was that sentence applied to one file after another.
That page now exists at explain.tabularis.dev. Its engine is a public npm package, @tabularis/explain, and the desktop app uses the same package.
How the feature was tied to the app
Before the extraction, Visual EXPLAIN could not leave the desktop app. Not because it needed a database connection. It never did. The problem was where the code lived.
On the Rust side, parsing was treated as part of the database driver. A driver did two different jobs: it ran the right EXPLAIN statement against the database, then translated the returned payload into a common plan model. The second job was pure data transformation, but placing it next to database access made the two responsibilities look inseparable.
The frontend had the same problem in a different form. Plan types, metrics, diagnostics and rendering logic had grown together. Analysis code depended on UI types, some statement logic lived beside plan logic, and two analysis modules imported each other at runtime. Diagnostics were also recomputed for every node on every render because the graph could not reuse work already done by its parent view.
None of this stopped the feature from working inside one application. The second host turned it into an architectural problem.
The first step was to make the dependencies point in one direction. Analysis could depend on the plan model, views could depend on analysis, and the host could depend on the package. Nothing inside the package should need to reach back into the host.
The extraction test
The rule I used for every file is now the first line of the package's description:
Takes raw EXPLAIN output; never runs a query.
Anything that passed this test moved to the package. Anything that failed stayed in the app. Statement building and the version fallback chains remained in the drivers. Tauri commands, the standalone window and file reading remained in the host. The AI plan explanation also stayed because it uses a provider configured by the host. The Monaco raw-output tab depended on the host theme, so it stayed too.
The decisions were not difficult once the rule existed. The problem was that these host features were threaded through otherwise portable code.
I moved the plan analysis and all the views into a @tabularis/explain workspace package. One important question remained: what should happen to the parsers?
Where should the parsers live?
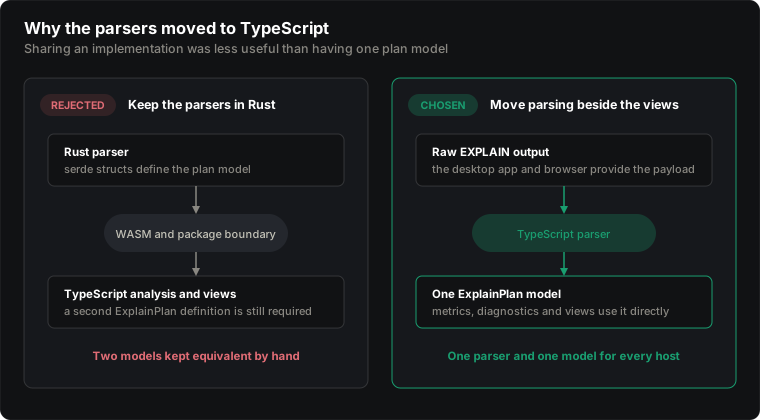
The parsers were written in Rust, so my first implementation kept them there. I moved them into a standalone crate with no dependencies beyond serde, then compiled it to WASM for the browser. The desktop app and the web visualiser parsed plans with literally the same implementation. It looked like the clean architecture.
Once it was working, the bill became clearer. The plan model would still exist twice: as serde structs in Rust and as TypeScript types in the package. Analysis, metrics, diagnostics and all the views are written in TypeScript, so they need those types regardless of where parsing happens. We would have two definitions of the same model, in two languages, kept in sync by hand. A parser change or support for a new database engine could require changes on both sides. The browser would also need a WASM artifact for the only part of the package that was not TypeScript.
The same parser in two hosts was attractive. One plan model was more valuable.
The parsers did not need to run where Rust runs. They needed to run where the views run.
So I moved the parsers into the package behind a common interface. They cover Postgres JSON and text, MySQL and MariaDB FORMAT=JSON and ANALYZE trees, and SQLite EXPLAIN QUERY PLAN. The existing parser tests moved with them, so the change of language did not also become a change of behaviour.
The Rust side kept the part that actually depends on the database. Drivers run the statement, handle the version fallbacks, and return a small envelope containing the engine, format and raw payload. Row-based formats are serialised without interpreting their meaning. From that boundary onward, the package owns the plan.
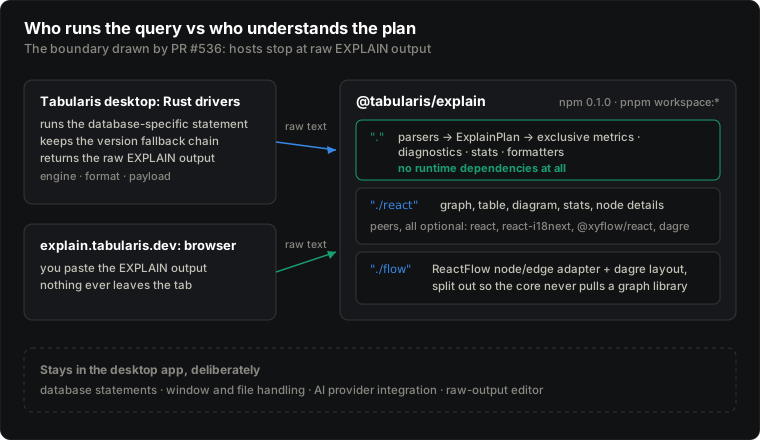
In the Tauri post I wrote that every result page pays the IPC tax. Plans still pay it, but now they cross as a payload instead of a parsed tree. Parsing happens once, on the side that owns the types. Any host holding raw EXPLAIN output now takes the same path from text to view.
What the extraction exposed
Once the parsers stood alone, an assumption became obvious. The old API tried to detect the payload format from its contents, but this only worked for the two Postgres forms. A MySQL EXPLAIN FORMAT=JSON document also starts with {, so it was treated as Postgres and then rejected because it did not have the expected shape.
The fix was to let the caller provide the database engine when it is known, while keeping format detection as a fallback. The bug had been present in the app for some time, but separating the parsers made the weak assumption much easier to notice.
The tests revealed a different gap. We had unit tests for the parsers, but no test for the fallback chain that chooses which EXPLAIN statement to run. The driver uses EXPLAIN ANALYZE on MySQL 8.0.18 and newer, ANALYZE FORMAT=JSON on MariaDB, and plain FORMAT=JSON when neither is available. This logic can only be tested properly against a server. It now has live tests that exercise all three branches using MySQL and MariaDB containers.
Once these parts were in place, version 0.1.0 went to npm.
Three entry points, and the bill
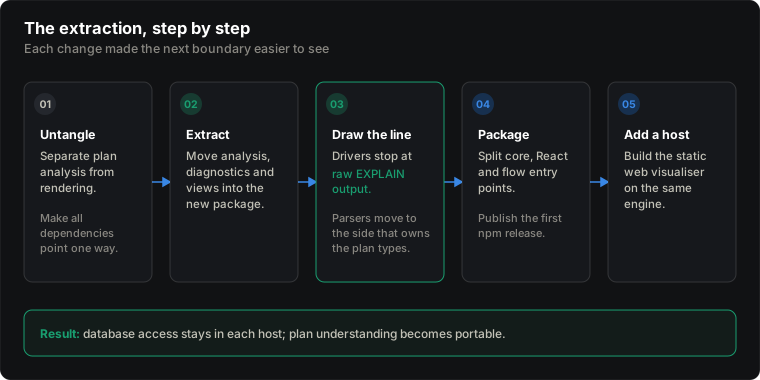
The package has three entry points. The split is the architecture:
@tabularis/explain: parsers, plan types, exclusive metrics, diagnostics, stats and formatters. It has no runtime dependencies, so plan analysis can run in a browser, a worker, a Node script or a test.@tabularis/explain/react: the graph, table, diagram, stats, node details and bars.@tabularis/explain/flow: the ReactFlow and dagre adapter, kept separate so the analysis core does not pull in a graph library.
All peer dependencies are optional, so a consumer only needs the dependencies required by the parts it imports. Inside the monorepo, the app can use the TypeScript source directly. Published consumers receive the compiled package instead. This keeps local development immediate without changing the public package contract.
Now for the bill. ./react is not a component kit you can drop into any application. The host must provide Tailwind with the colour tokens used by the desktop app, an initialised react-i18next instance with the editor.visualExplain.* namespace, and the ReactFlow stylesheet when rendering the graph. The package is portable, but its views are not independent of their host.
The desktop app provides the strings in eleven languages, while the standalone site currently provides only English. The two consumers also update differently: the app tracks workspace:*, while the site tracks releases on npm. This is a synchronisation cost that did not exist while everything lived in one codebase.
One repository or two?
For now, @tabularis/explain remains a workspace package inside the Tabularis monorepo. This is excellent during development. The desktop app resolves the package directly to its TypeScript source, so a change to a parser, a diagnostic and the view that displays it can all happen in one commit. The app tests the package as part of its normal test suite, and I can change both sides of the boundary without publishing an intermediate version to npm.
The monorepo becomes less convenient when the package is considered as a product of its own. It needs releases and a changelog that make sense to people who do not follow the desktop app. A change may be internal to Tabularis, public for package consumers, or relevant to both. The current application changelog is not a particularly good place to explain all three. Versioning and release notes also become easier to get wrong when the app and the package move in the same repository but publish on different schedules.
A separate repository would make that independence explicit. The package could have its own issues, documentation, changelog and release cadence. On the other hand, every change that crosses the driver and parser boundary would then cross repositories too. Testing an app change against an unpublished package version would require more work, and a refactor that is atomic today could become a pair of coordinated pull requests.
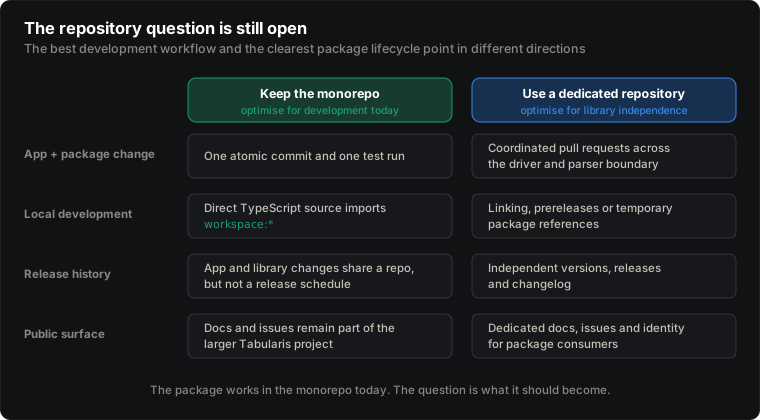
I do not yet know which cost matters more. Keeping the package in the monorepo gives the best development experience today. Moving it out may give it a clearer life as a public library. Now that there are two hosts and external consumers are possible, this is no longer just a question about where the files look tidier.
The second host
The standalone visualiser is mostly a page shell, examples and translations around the package. It runs entirely in the browser. It does not execute queries or upload plans to a server. The deployed site is just a static bundle.
The same extraction rule also guided a product decision for the site. AI plan analysis does not take only a plan: it depends on a provider configured by the host. For this reason, the online visualiser does not offer it. Instead, the corresponding tab explains that the feature is available in the desktop app.
The extracted analysis had also improved shortly before this work. In the same period, #529 added exclusive metrics. Previously, views ranked nodes using the figures reported by the database. Those figures include the work of child nodes and are often averages per loop, so the plan root appeared to be the most expensive node in nearly every plan.
This was technically accurate and practically useless.
The package now recalculates metrics for each node before displaying them. It also reports hotspots, row estimates that are wrong by more than 10x, sorts spilling to disk and filters discarding nearly every row. In a tool where you paste a plan, these findings are a large part of the product.
The extraction was merged as #536, with the app's 3,286 tests passing.
Would I draw the boundary again?
Yes, and earlier.
I started the extraction because the online visualiser needed it. But most of the immediate value appeared in the desktop app before the site existed. The import cycle is gone. Diagnostics are computed once per plan instead of once per node on every render. The format detection bug is fixed, and the fallback chain finally has tests. The code that answers "what does this plan mean?" no longer depends on the code that draws it.
This does not mean that moving code into a package automatically improves it. A bad boundary in its own repository is still a bad boundary. What helped was having a rule that described ownership instead of directories.
That rule is still the most useful result for me: takes raw EXPLAIN output; never runs a query. It sorted the files, determined what the drivers should return, chose the language for the parsers, and guided the decision about the AI tab on the standalone site. When one sentence makes that many decisions, the boundary was already real. The code had simply failed to express it.
The plan visualiser needed a plan, not a database. Now it does not even need Tabularis. You can paste a plan and see, although I would still prefer you used Tabularis.